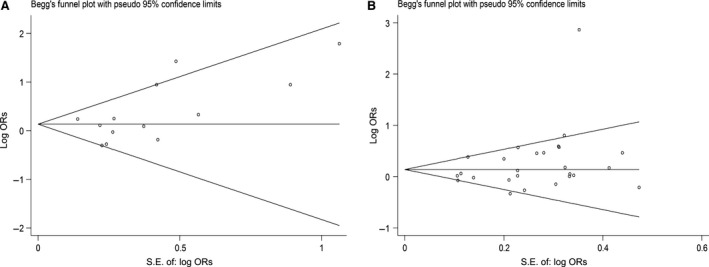
Figure 5.

(A) Begg's funnel plot for publication bias test for MspI polymorphism (the dominant model CC + CT versus TT). Each point represents a separate study for the indicated association. (B) Begg's funnel plot for publication bias test Ile/Val polymorphism (the dominant model GA+GG versus AA). Each point represents a separate study for the indicated association.
