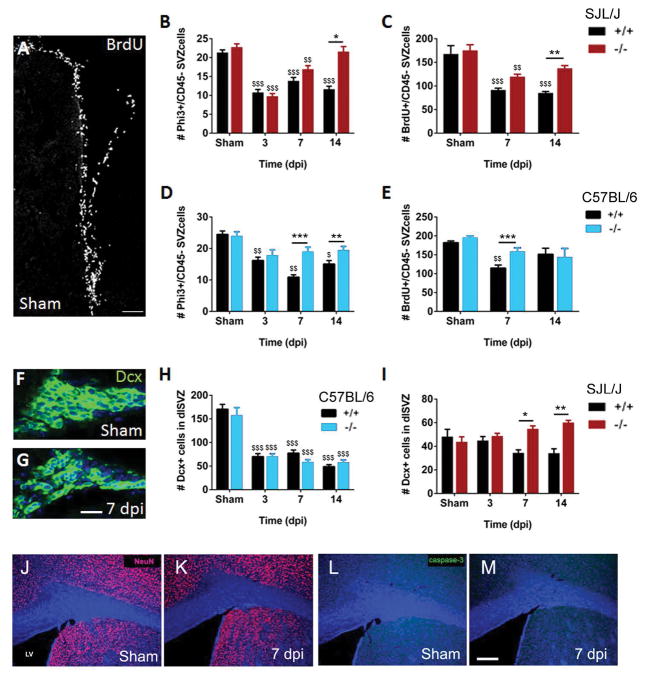
Fig. 5. Decreased SVZ proliferation after TMEV infection was blocked in Gal-3−/− mice.
(A) Pulse-labeled BrdU+ cells in the SVZ of a sham WT SJL/J mice. (B–C) Quantification of Phi3+/CD45− and BrdU+/CD45− cells (proliferating cells of the neural lineage) in the SVZ after TMEV. (D–E) Quantification of Phi3+/CD45− and BrdU+/CD45− cells in the SVZ of C57BL/6 mice after TMEV. (F–G) Dcx immunohistochemistry in the SVZ of a sham C57BL/6 mouse and 7 dpi (G) showing disruption and loss of Dcx+ cells. DAPI nuclear counterstain (blue). (H–I) Quantification of number of Dcx+ cells in the dorsolateral SVZ of C57BL/6 and SJL/J WT and Gal-3−/− mice. *P<0.05 Gal-3−/− compared to WT, ** P<0.01, ***P<0.001, $ P<0.05 TMEV treated compared to shams, $$ P<0.01. (J–K) NeuN immunoreactivity in shams compared to 7 dpi. (L–M) Caspase-3 immunoreactivity in shams compared to 7 dpi in WT. Scale bars: A=30 μm; G=15 μm; M=200 μm.

