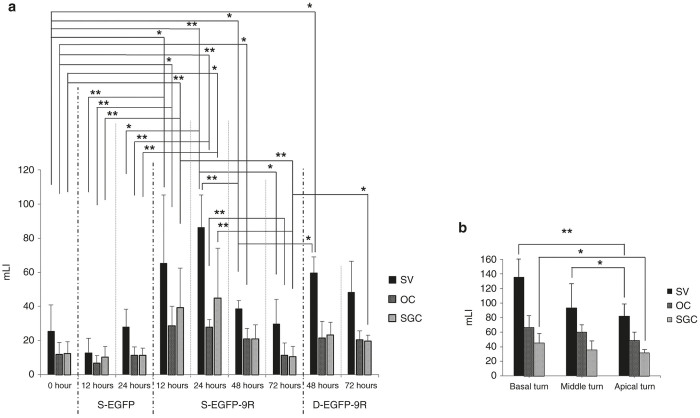
Figure 3.
Quantification of protein transduction levels via mLI. (a) The mLIs in the s-EGFP, s-EGFP-9R and d-EGFP-9R groups are shown. The mLIs of the treated-side cochleae in the s-EGFP-9R Group peaked at 24 hours, decreased over time, and became approximately equal to that in 0 hours by 72 hours. (b) The mLIs at each turn at 24 hours in the s-EGFP-9R Group are shown. The mLI in the SV and SGC at the lower turns was generally higher, versus at the higher turns. Each n = 5. *P < 0.05; **P < 0.01.

