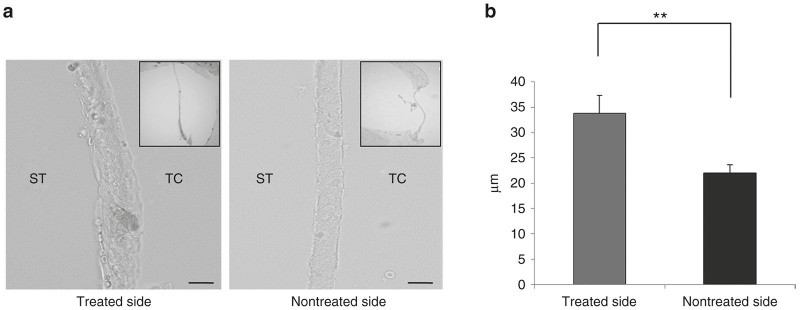
Figure 4.
RWM thickness. (a) Typical sectional images of the round window membrane (RWM) at 24 hours in the s-EGFP-9R group. The RWM thickness in treated-side cochleae appears to be thicker than that in nontreated cochleae. Scale bars indicate 20 μm. ST: scala tympani; TC: tympanic cavity. (b) The thickness of the RWM in the s-EGFP-9R group. The thickness of the RWM in treated-side cochleae was significantly greater than that in nontreated cochleae in the s-EGFP-9R group. Each n = 5. **P < 0.01.

