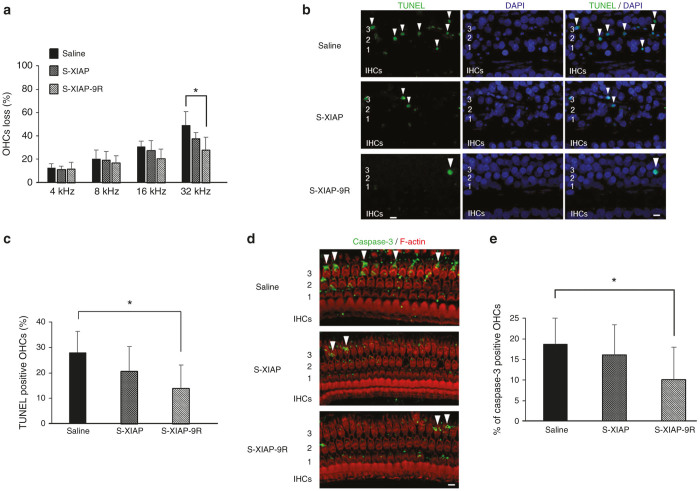
Figure 7.
XIAP experiment results. (a) Quantification of outer hair cells (OHC) loss at each frequency region at 14 days after treatment is shown. OHC loss at the 32-kHz region in the S-XIAP-9R group was significantly lower than that in the saline group. Each n = 5. *P < 0.05. (b) Surface preparations from the basal turns of cochleae at 2 days after noise exposure. TUNEL-positive nuclei are indicated by white arrowheads. IHCs: inner hair cells. 1, 2, and 3: first, second, and third rows of OHCs. The scale bar indicates 10 μm. (c) Quantification of TUNEL-positive cells in the 32-kHz region. The number of TUNEL-positive cells in the s-XIAP-9R group was significantly lower than that in the saline group. Each n = 5. *P < 0.05. (d) Surface preparations of the 32-kHz region of a cochlea at 1 day after noise exposure. Cleaved caspase-3-positive cells are indicated by white arrowheads. 1, 2, and 3: first, second, and third rows of OHCs. The scale bar indicates 10 μm. (e) Quantification of cleaved caspase-3-positive OHCs from the basal regions. The number of cleaved caspase-3-positive OHCs in the s-XIAP-9R group was significantly lower than that in the saline group. Each n = 5. *P < 0.05.

