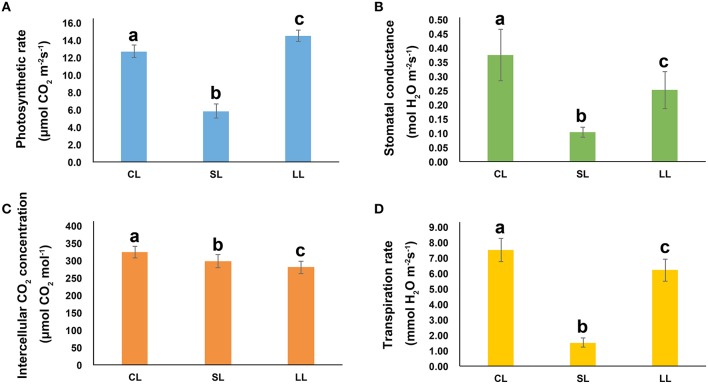
Figure 1.
The Response of Populus euphratica to ABA. (A) Photosynthetic rate, (B) stomatal conductance, (C) intercellular CO2 concentration, and (D) transpiration rate of P. euphratica in response to ABA treatments for different amounts of time. Data are mean ± SE (n = 6). The values with different lowercase letters are significantly different at the P < 0.05 level.

