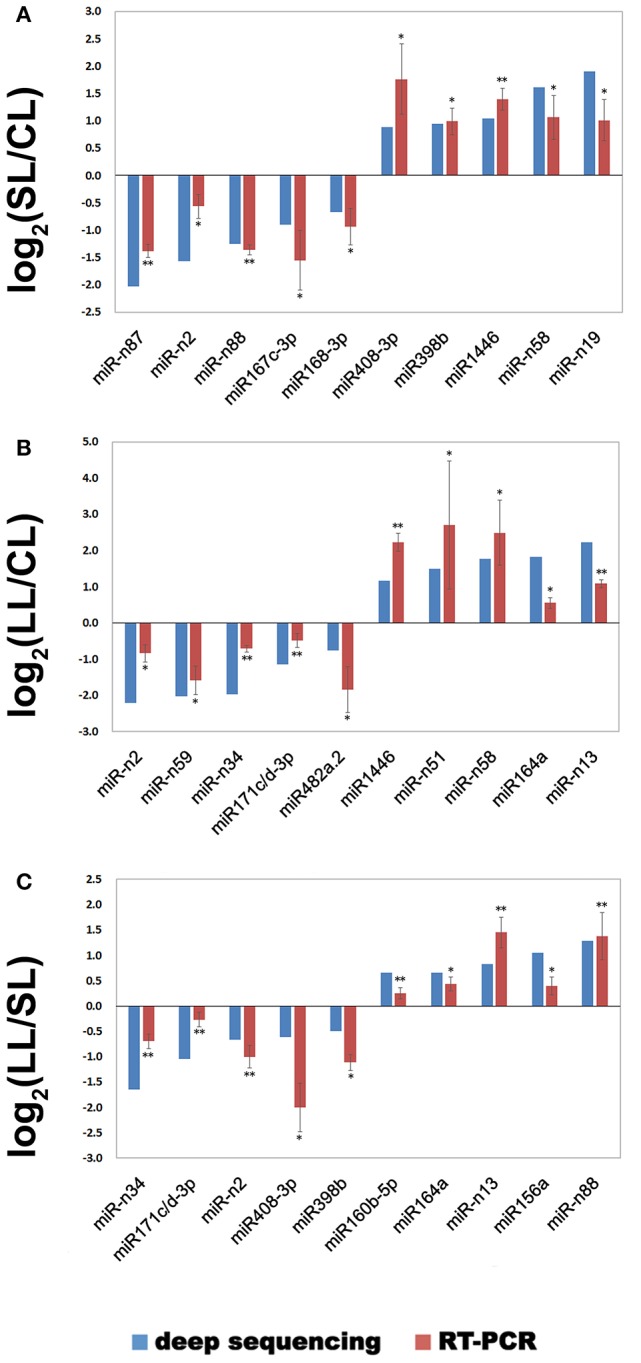
Figure 5.

Verification of selected miRNAs by real-time quantitative PCR. Differentially expressed miRNAs identified by sequencing were confirmed by real-time qPCR, and their expression levels were compared among the three groups. The expression level of miRNA in deep sequences was performed with R statistical software package, which was“DESeq2” library used with raw date. *P < 0.05, **P < 0.01. (A) The miRNA expression for the comparison SL/CL; (B) The miRNA expression for the comparison LL/CL; (C) The miRNA expression for the comparison LL/SL.
