
Fig. 11.
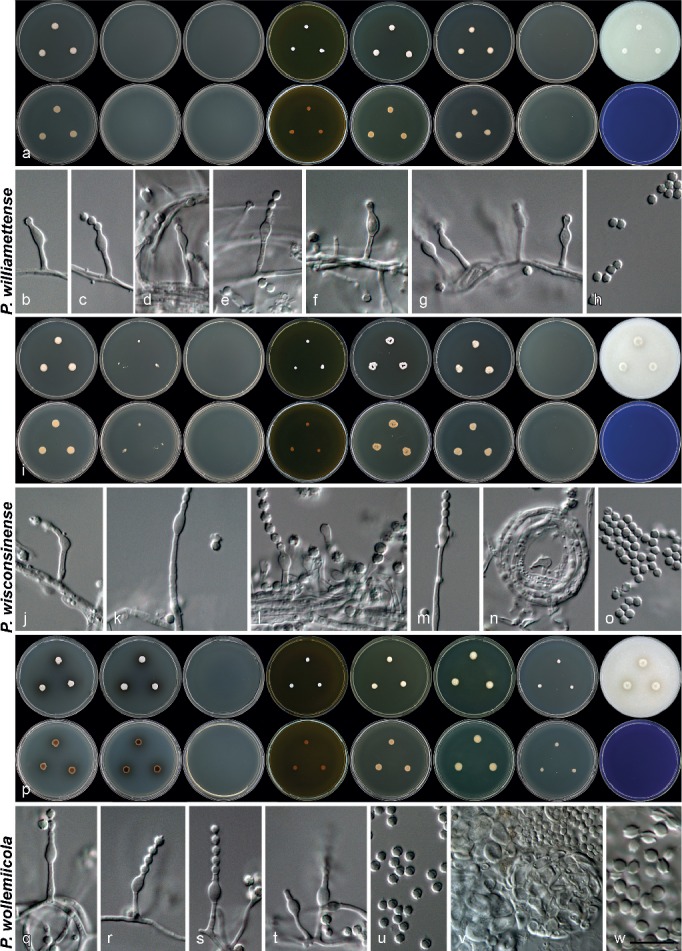
Morphology of species characterised in this study. a, i, p. Colony morphology from left to right, top row: CYA, CYA 30 °C, CYA 37 °C, MEA, YES, DG18, CYAS, OA; from left to right, bottom row: reverse colonies on CYA, CYA 30 °C, CYA 37 °C, MEA, YES, DG18, CYAS and obverse on CREA; b–h, j–o, q–w. conidiophores, conidia, ascocarps (in v) and asci (in w) produced on OA. — Scale bar: w = 10 μm, applies to all microscope pictures, except v = 20 μm.