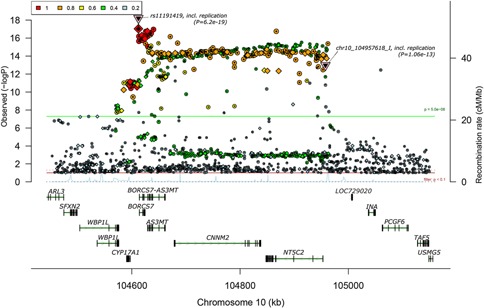
Figure 1.

Genetic association with schizophrenia in a region of strong linkage disequilibrium on chromosome 10q24.32‐q24.33. Plot generated by Ricopili (http://www.broadinstitute.org/mpg/ricopili/) using the PGC_SCZ52_may13 dataset described in the Schizophrenia Working Group of the Psychiatric Genomics Consortium [2014] study. Positions of rs11191419 and ch10_104957618_I are indicated by triangles. The threshold of genome‐wide significance (P < 5 × 10⁻⁸) is indicated by a green horizontal line. Color key indicates r2 between the variant at the locus showing most significant association with schizophrenia (rs11191419) and other variants in the region. [Color figure can be seen in the online version of this article, available at http://wileyonlinelibrary.com/journal/ajmgb]
