
Figure 1.
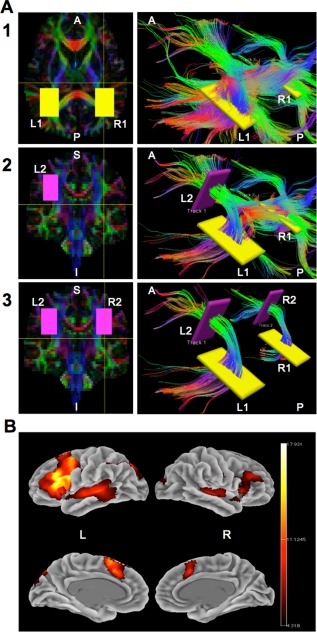
Visualization of the reconstructed streamlines of the direct pathway of the arcuate fasciculus (AF) and the group fMRI activation maps. (A) Diffusion Toolkit was used to visualize the 3D tract reconstruction (right column) and delineate the arcuate fasciculus streamlines in each hemisphere for each subject using the color‐coded diffusion map and a region of interest (ROI) approach (left column). Portions of streamlines along the anterior–posterior direction are represented in green, along the left‐to‐right direction are represented in red/orange, and along the superior–inferior direction are represented in blue/purple. (1) First, two large rectangular ROIs were manually drawn for each hemisphere on an axial slice (left panel) lateral to the ventricular trigone in the temporal region (L1 and R1 in yellow). All streamlines passing through any part of these two ROIs are visualized in the right panel. (2) Next, a large rectangular ROI is drawn on a coronal slice (left panel) at the level of the left frontal operculum (L2 in pink). Only streamlines that pass through both L1 and L2 are counted as part of the left hemisphere AF (Track 1), but all streamlines passing through R1 are still visualized, as shown in the right panel. (3) Then, a second rectangular ROI is drawn on the coronal slice (left panel) at the level of the right frontal operculum (R2 in pink). Only streamlines that pass through both R1 and R2 are counted as part of the right hemisphere AF (Track 2). (B) Statistical parametric map of group activation during the verb generation fMRI task for a cohort of 214 healthy subjects. Clusters of significant activation (FWE p < 0.05) were utilized to create a binary mask for calculating a lateralization index value for each subject. L = left, R = right, A = anterior, P = posterior, S = superior, I = inferior.