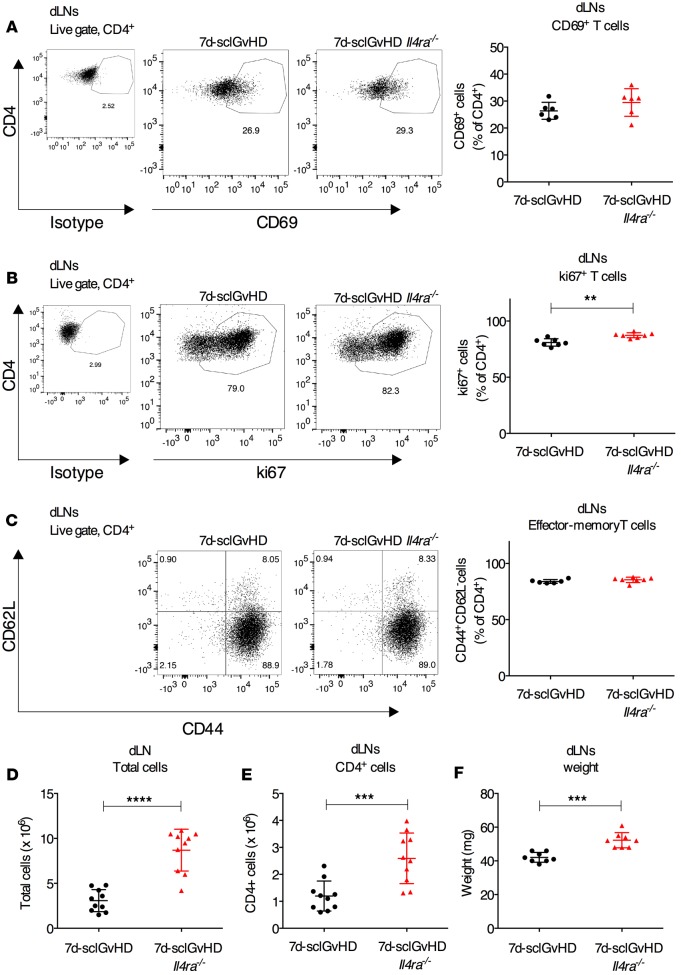
Figure 2. Increased alloreative CD4+ T cells in the dLNs of 7d-sclGvHD Il4ra–/– mice.
(A–C) Representative FACS plots and quantification of CD4+ cells expressing (A) CD69, (B) ki67, or (C) naive/TEM markers (CD44 and CD62L) in the dLNs of 7d-sclGvHD and 7d-sclGvHD Il4ra–/– mice (n = 6–7 per group, **P < 0.01, Student’s t test). (D and E) Absolute number of (D) total cells and (E) CD4+ T cells isolated from the dLNs of 7d-sclGvHD and 7d-sclGvHD Il4ra–/– mice (n = 10 per group, ****P < 0.0001 and ***P < 0.001, Student’s t test). (F) dLN weight isolated from 7d-sclGvHD and 7d-sclGvHD Il4ra–/– mice (n = 8 per group, ***P < 0.001, Student’s t test). Data are means ±SD. The graphs represent data pooled from 3 independent experiments.

