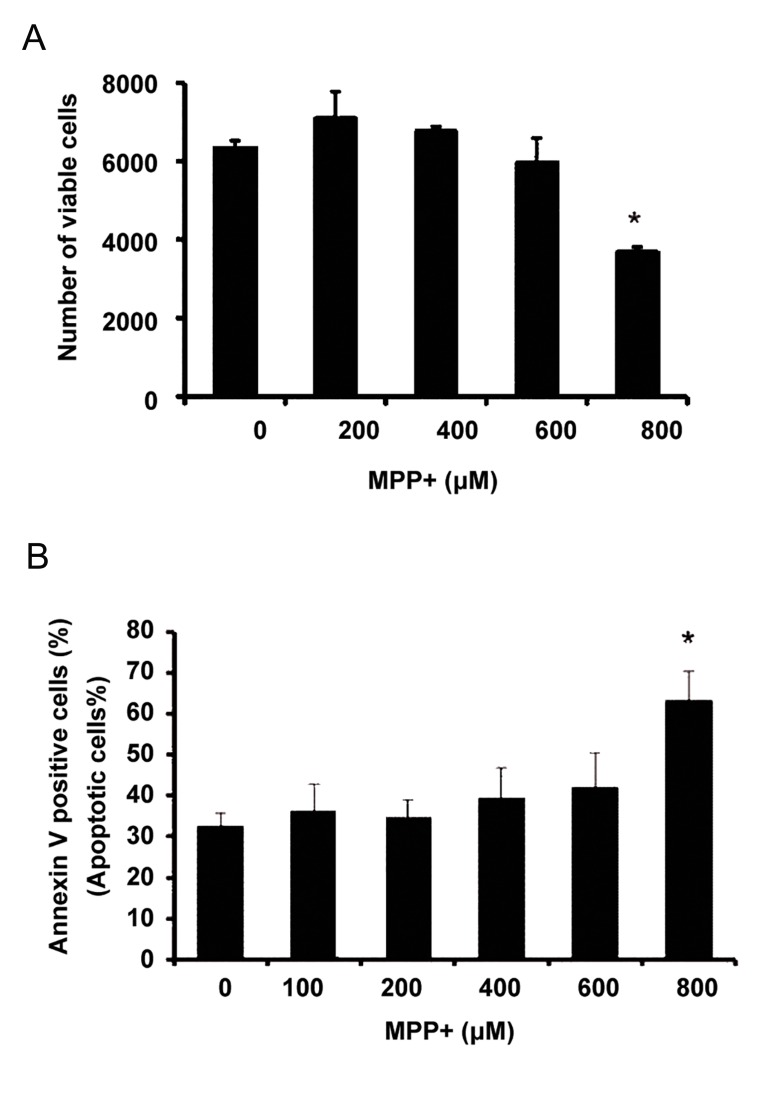
Fig.2.
PC12 cell proliferation and apoptosis modulation under MPP+ treatment. A. Viable cell estimation by MTS assay under treatment with different concentrations of MPP+ and B. Flowcytometry analysis of apoptotic cells under treatment with different concentrations of MPP+. Results were expressed as the percentage of cell number after treating with various concentrations of MPP+ relative to the cell number of the control sample. Values represent mean of triplicate independent experiments ± SEM. *; Indicates significant difference between treated and the control sample (0 µM of MPP+) at P<0.05, MPP+; 1-methyl-4-phenylpyridinium and MTS; (3-(4,5-dimethylthiazol-2-yl)-5-(3-carboxymethoxyphenyl)-2-(4-sulfophenyl)-2H-tetrazolium).

