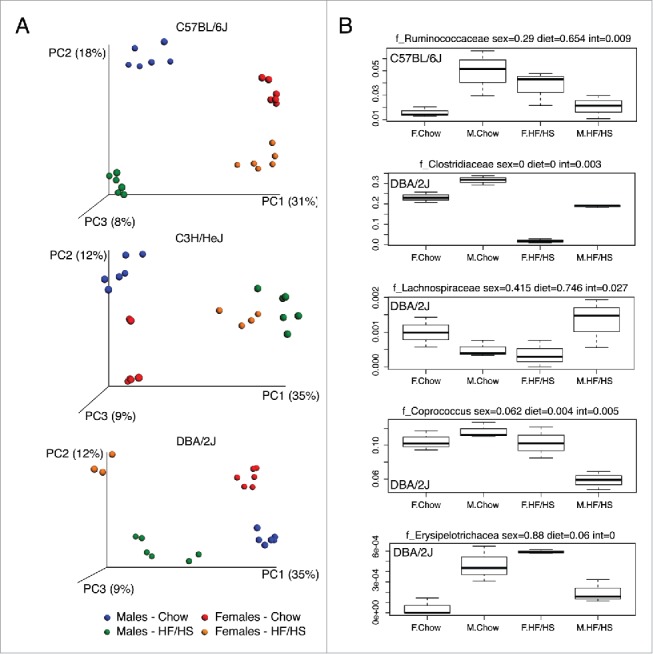
Figure 2.

Principal coordinate analysis (PCoA) plot of unweighted UniFrac distances between male and female mice. C57BL/6J, C3H/HeJ, and DBA/2J strains fed a normal chow or high fat diets were studied as described in the text. PC1, PC2, and PC3 values for each mouse sample are plotted with the percent variation explained by each PC is shown in parentheses. (B) Examples of sex-by-diet interactions with 5 taxa in female and male from C57BL/6J and DBA/2J mice fed with chow or high fat diets. P values from MANOVA analysis are shown for sex, diet and sex-by-diet interactions (int).
