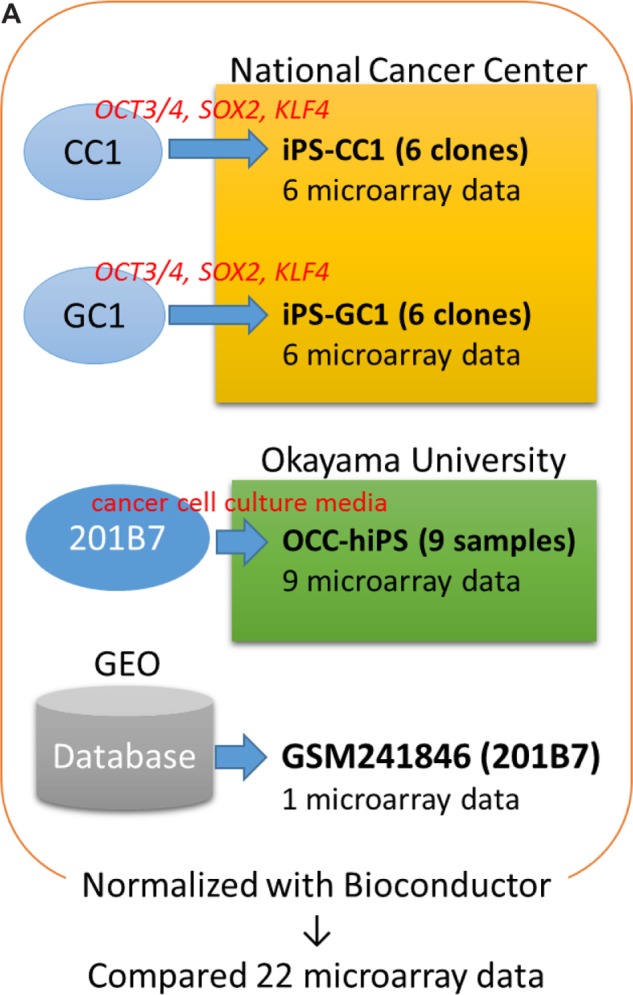
Figure 1.

Flowchart of the experimental procedure.
Notes: (A) Twenty-two samples were analyzed with microarray experiments, and the data were compared with hiPSC 201B7 data from GEO (GSM241846) after normalization. (b and C) To detect differentially expressed genes/probes, two parameters were used for gene selection; one is (b) |G-A|-2V > 0 and another is (C) max–min > average + 2SD. (b) G, A, and V are denoted as follows: the average of gene expression level among the CSCs, the gene expression level of hiPSC 201B7, and the SD of the gene expression level among the CSCs, respectively. These values were calculated with I, which was described in the “Materials and methods” section. (C) Average + 2SD was calculated with the max–min value. These values were calculated with Bioconductor normalized intensity for each gene. Normalized intensity i’ was shown in base-2 logarithm on Y-axis. For Figure 2, a gene set was made by only one parameter (b). To list up genes that have much difference, parameter (C) in addition to (b) was used for each gene set of Figures 3–5. Using each gene set, sSOM analysis was performed with I.

