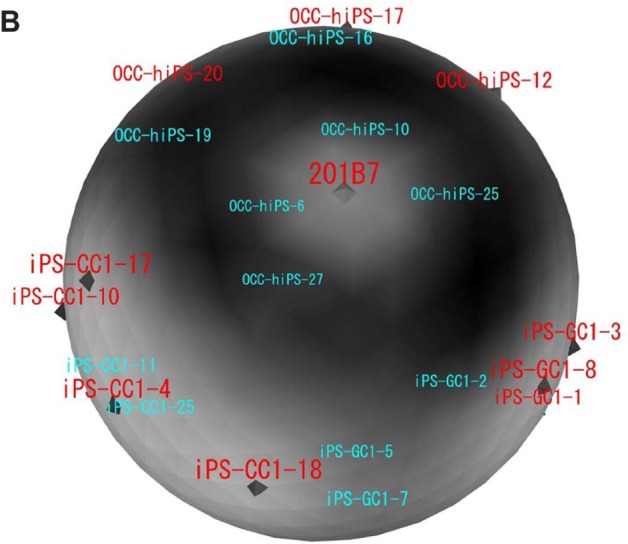
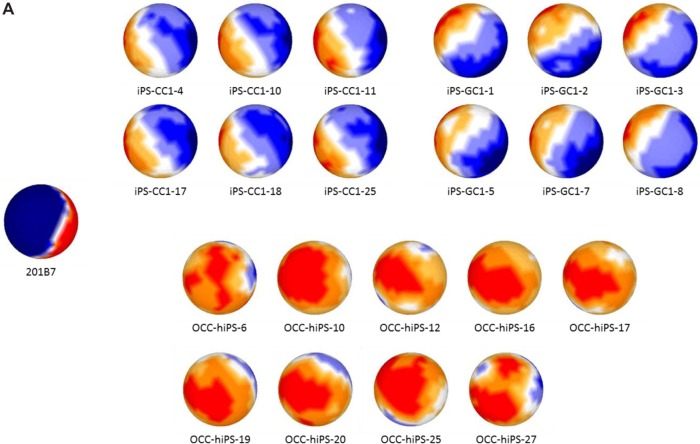
Figure 2.

Mapping and clustering of normal hiPS and all the CSCs with sSOM. Microarray data of hiPSC 201B7 were obtained from NCBI GEO (GSM241846), and those of the CSCs were obtained as our original data.
Notes: (A) Gene expression patterns were analyzed by sSOM with the microarray data of GSM241846 and the CSCs. The data were used 2678 probes, which were extracted by |A-G|-2V > 0. (b) Each of the CSCs and hiPSC 201B7 was mapped on a sphere by sSOM analysis. The CSCs were clustered into three groups with sSOM. Each of analyzed CSCs was depicted on a sphere. The CSCs named in red color were mapped on the front side of the sphere. The CSCs named in light blue color were mapped on the back side of the sphere.

