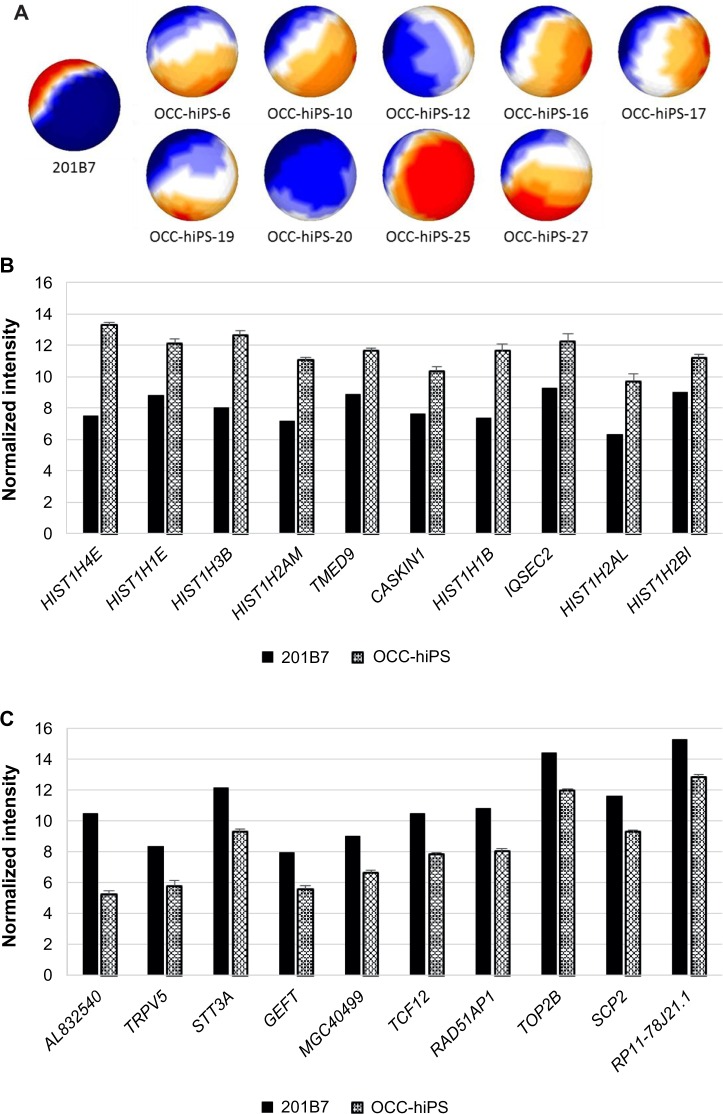
Figure 5.
Mapping and comparison of normal hiPSC and OCC-hiPS with sSOM.
Notes: (A) Gene expression patterns analyzed by sSOM with the microarray data of 201B7 (GSM241846) and OCC-hiPS. The data were used 402 genes, which was extracted by the two parameters (see Fig. 1). Each of OCC-hiPS was mapped as a sphere by sSOM analysis. The normalized intensities of 255 upregulating genes (b) or 147 downregulating genes (C) of OCC-hiPS, which were compared to GSM241826, were analyzed by sSOM. Ten genes close to the IP were aligned by the order of NSD as listed in Tables 6 and 7. Graphs were depicted as mean + SD. Normalized intensity i’ was shown in base-2 logarithm on Y-axis.

