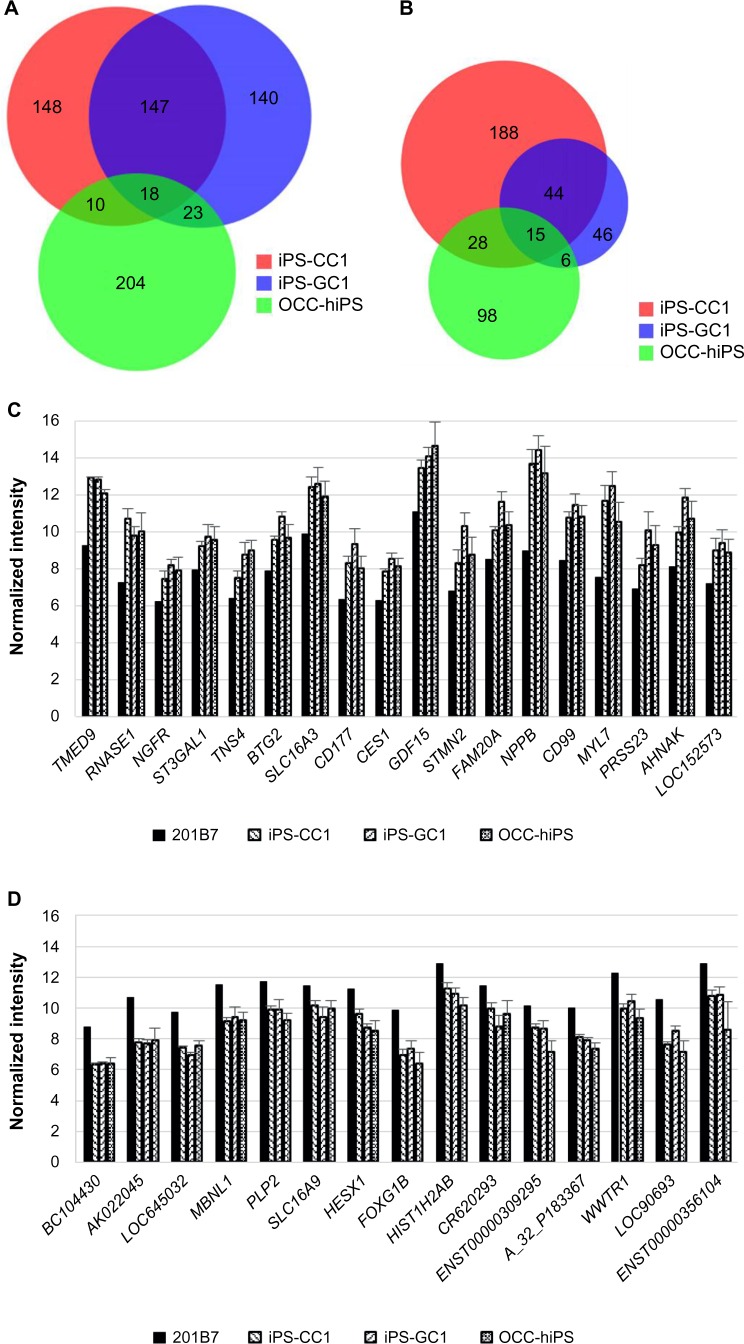
Figure 6.
Venn diagrams of upregulating genes or downregulating genes extracted by each sSOM analysis of iPS-CC1, iPS-GC1, and OCC-hiPS.
Notes: Venn diagrams of upregulating genes (A) or downregulating genes (b) describing in the legends of Figures 2–4. The numbers of genes were in each area. Each of the upregulating (C) or downregulating (D) genes commonly among all the CSCs was shown left to right in the order of NSD from the IP. Graphs were depicted as mean + SD. Normalized intensity i’ was shown in base-2 logarithm on Y-axis.

