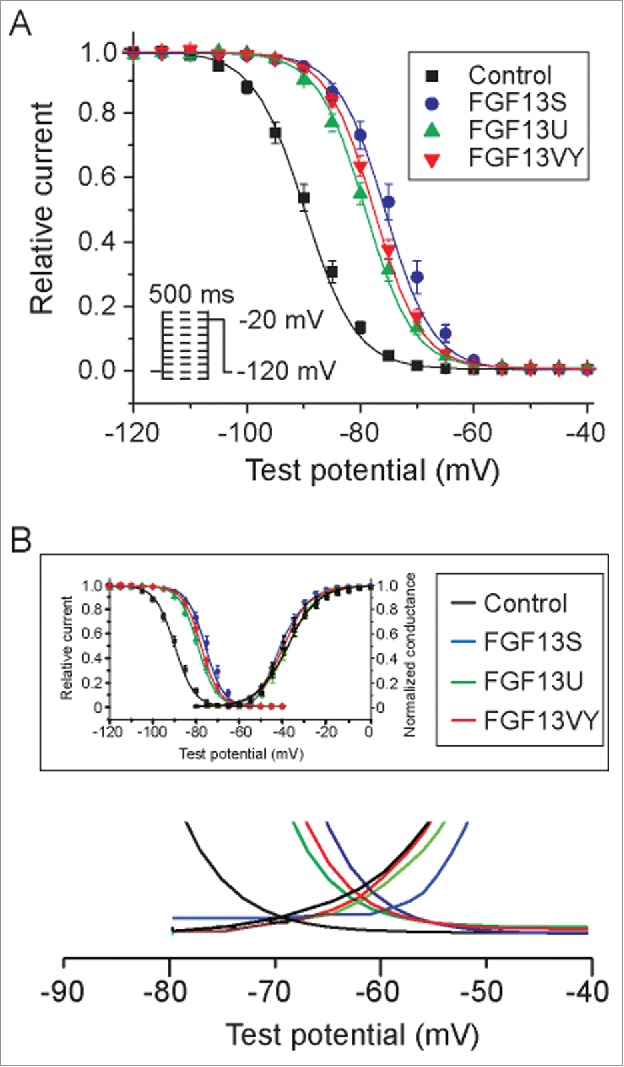
Figure 4.

Voltage dependence of steady-state inactivation. (A) Inactivation was elicited by a 500 ms conditioning pulse from a holding potential of −120 mV to voltages between −130 and −10 mV in 5 mV increments prior to a test pulse at −20 mV (inset). Cells co-expressing Nav1.5 and FGF13 isoforms (FGF13S, FGF13U, FGF13VY) displayed an availability curve that was significantly depolarized shift comparing to cells expressing Nav1.5 and IRES-GFP (Control). (B) FGF13 isoforms increase window current.
