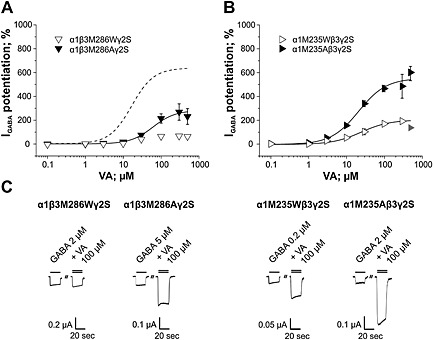
Figure 5.

Effects of mutating residues β3M286 and α1M235 on efficacy and potency of I GABA enhancement by VA are illustrated. Concentration‐response curves for VA‐induced I GABA enhancement on (A) α1β3M286Wγ2S and α1β3M286Aγ2S and (B) α1M235Wβ3γ2S and α1M235Aβ3γ2S receptors are shown. Dashed line in (A) represents I GABA enhancement by VA on wild‐type channels. Responses in each cell were normalized to a submaximal GABA EC3–7 concentration determined at the beginning of each experiment. Data points represent the mean ± SEM of ≥6 oocytes from at least two batches. Error bars smaller than the symbol are not shown. Grey symbols are excluded from the fit. (C) Representative current traces in the presence of 20 s application of a GABA EC3–7 concentration (single bar) or co‐application of GABA EC3–7 and 100 μM VA recorded from Xenopus laevis oocytes voltage‐clamped at −70 mV expressing the indicated receptor subtype.
