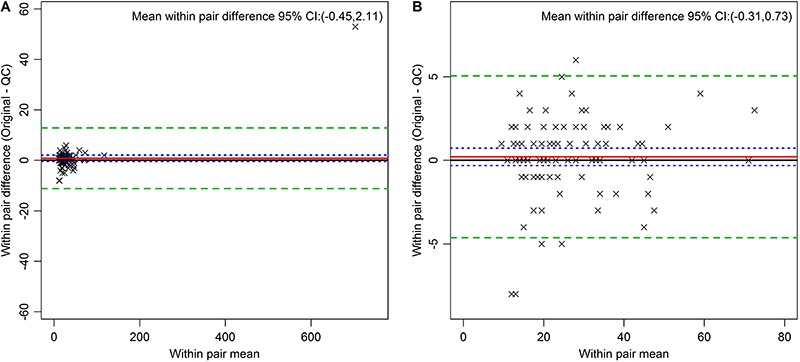
Figure 2. Bland Altman plots for alanine transaminase in U/L (all pairs, Panel A; after exclusion of outliers, Panel B). The red line indicates the mean within pair difference found between the original and the quality control (QC) measures. The green dashed lines indicate 2 standard deviations above and below this mean, and the blue dotted line the 95%CI for the mean of the within pair difference.

