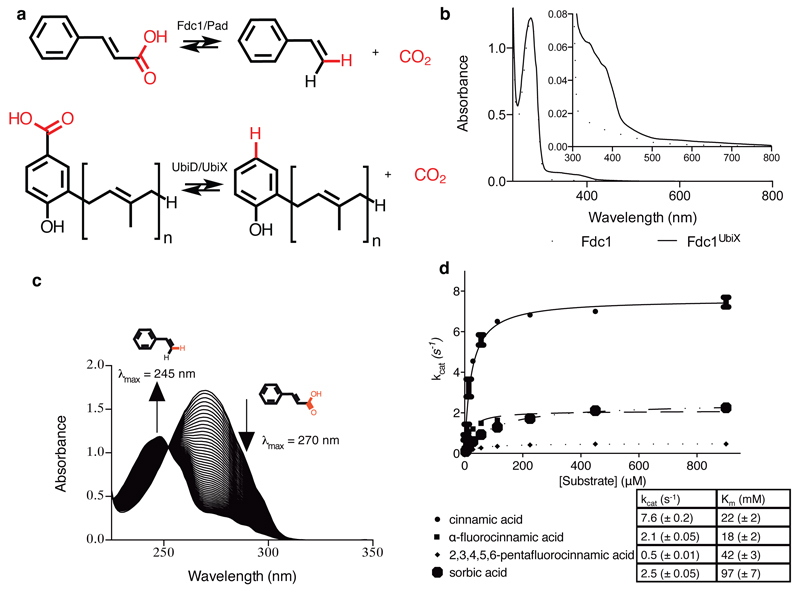
Fig 1. Fdc solution data.
a) Schematic overview of the reaction catalysed by Fdc/Pad and the related UbiD/UbiX proteins. b) UV-Vis spectra obtained for heterologous expressed A. niger Fdc, with and without co-expression of a ubiX gene. c) UV-vis observation of the enzymatic conversion of cinnamic acid to styrene via decarboxylation by FdcUbiX. The initial spectrum of cinnamic acid shows a λmax of 270 nm. Over time successive spectra show reduction of the 270 nm peak and appearance of a peak at 245 nm corresponding to styrene formation. d) Steady state kinetic parameters obtained for FdcUbiX for sorbic acid and a variety of cinnamic acid-type compounds (error bars are s.e.m. n=3).

