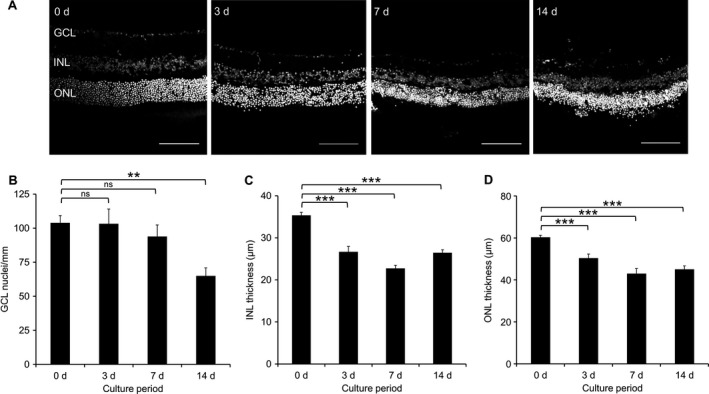
Figure 1.

Nuclear stained frozen sections of explants cultured for up to 14 d. (A) Representative 8‐bit images of TO‐PRO‐3 labelled sections; scale bars 100 μm. (B) Linear cell counts of GCL show cell loss after 14 d. **P < 0.005, ns, not significant, anova with Tukey post hoc. (C) INL thickness measured after each culture period show layer thinning after 3 d. ***P < 0.001, anova with Tukey post hoc. (D) ONL thickness measured after each culture period show layer thinning after 3 d. ***P < 0.001, Mann–Whitney with Bonferroni correction. n = 5 retinas, 3 animals (0 d), n = 6 retinas, 5 animals (3 d), n = 3 retinas, 3 animals (7 d), n = 4 retinas, 4 animals (14 d). At least three sections from each retina were analysed. Error bars ± SEM. d, days.
