Figure 3.

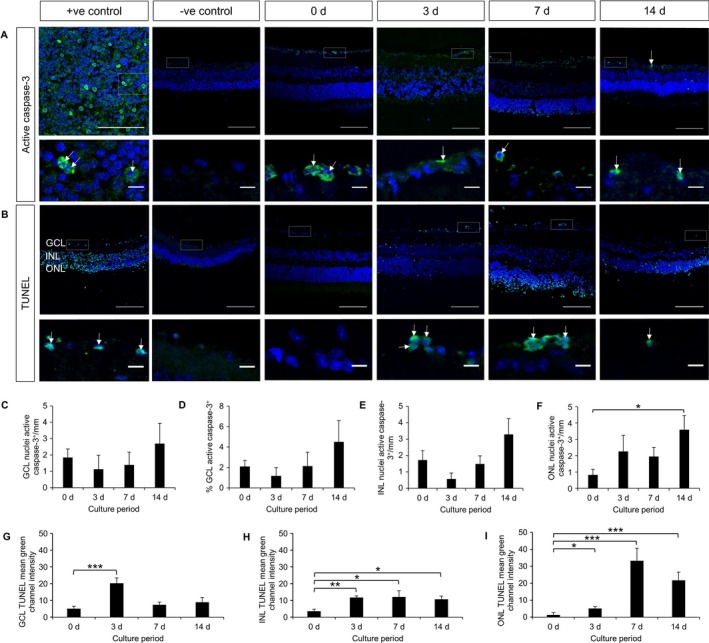
Fluorescent staining of apoptotic markers, active caspase‐3 and TUNEL in frozen sections of explants cultured for up to 14 d. (A) Active caspase‐3 staining (green) with TO‐PRO‐3 nuclear stain (blue) over 14 d at 20× magnification (top) and higher magnification of areas highlighted with dashed boxes to show individual cells (bottom). Active caspase‐3 staining tended to increase with time. Arrows indicate active caspase‐3 positive cells. Positive control: spleen. Scale bars: 100 μm (top), 10 μm (bottom). n = 5 retinas, 3 animals (0 d); n = 3 retinas, 3 animals (3 d); n = 3 retinas, 3 animals (7 d); n = 5 retinas, 5 animals (14 d). (B) TUNEL labelling (green) with TO‐PRO‐3 nuclear stain (blue) over 14 d at 20× magnification (top) and higher magnification of areas highlighted with dashed boxes to show individual cells (bottom). TUNEL labelling increased over time. Arrows indicate TUNEL‐positive cells. Positive control: proteinase‐k‐digested retinal sections. Scale bars: 100 μm (top), 10 μm (bottom). n = 4 retinas, 3 animals (0 d); n = 4 retinas, 4 animals (3 d); n = 3 retinas, 3 animals (7 d); n = 3 retinas, 3 animals (14 d). (C) Number of active caspase‐3‐positive cells in GCL quantified per mm. P > 0.05, Mann–Whitney with Bonferroni correction. (D) Number of active caspase‐3‐positive cells in GCL quantified as % of cells in GCL. P > 0.05, Mann–Whitney with Bonferroni correction. (E) Number of active caspase‐3‐positive cells in INL quantified per mm. P > 0.05, Mann–Whitney with Bonferroni correction. (F) Number of active caspase‐3‐positive cells in ONL quantified per mm. *P < 0.05, Mann–Whitney with Bonferroni correction. (G) TUNEL staining in GCL quantified as mean green channel fluorescence, normalized for background fluorescence. ***P < 0.001, Mann–Whitney with Bonferroni correction. (H) TUNEL staining in INL quantified as mean green channel fluorescence, normalized for background fluorescence. *P < 0.05, **P < 0.005, Mann–Whitney with Bonferroni correction. (I) TUNEL staining in ONL quantified as mean green channel fluorescence, normalized for background fluorescence. *P < 0.05, ***P < 0.001, Mann–Whitney with Bonferroni correction. At least three sections from each retina were analysed. Error bars ± SEM. d, days.
