Figure 5.

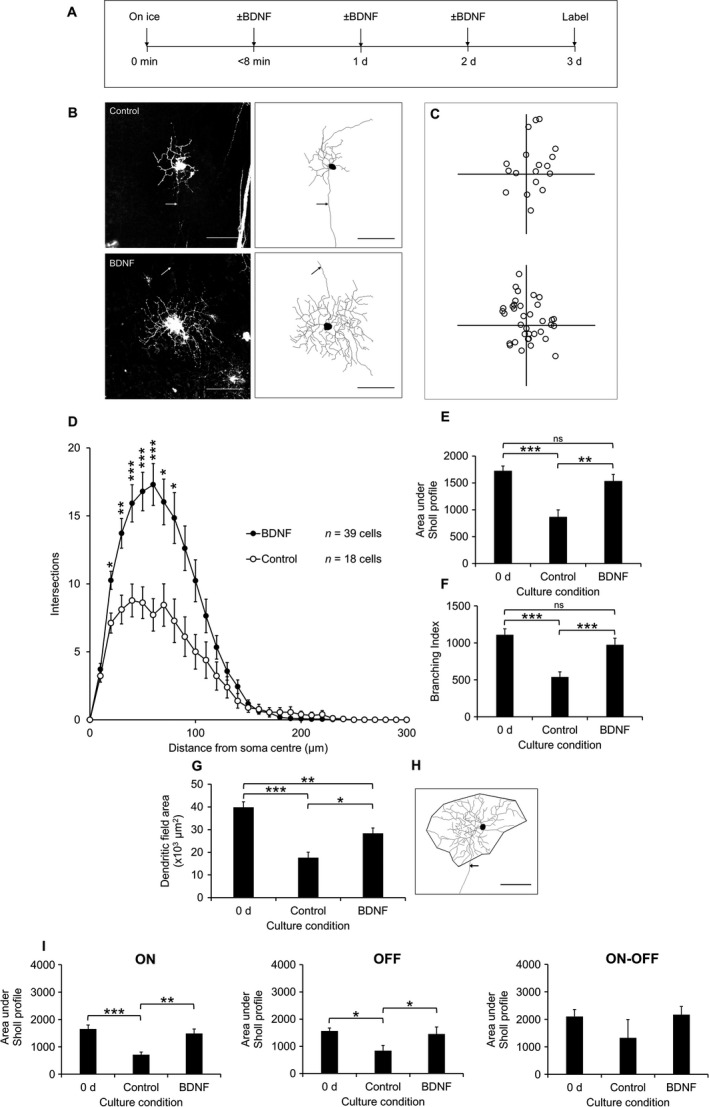
Diolistically labelled RGCs from explants cultured with 100 ng/mL BDNF, or vehicle (PBS, 0.1% BSA) as control, over 3 d showing retardation of dendritic atrophy in the presence of BDNF. (A) Time course of experiment. (B) Representative 1024 × 1024 pixel images of RGCs from control (top) and BDNF (bottom) with 8‐bit tracing images for each cell (right); scale bars 100 μm; arrow indicates axon. (C) Locations of RGCs from control (top) and BDNF‐treated (bottom) explants plotted relative to the optic nerve head (origin). (D) Sholl profiles for RGCs in each group. *P < 0.05, **P < 0.005, ***P < 0.001, Kruskal–Wallis. (E) Area under Sholl profiles in each group, shown with the 0 d value for comparison. **P < 0.005, ***P < 0.001, ns, not significant, anova with Tukey post hoc. (F) Branching index. ***P < 0.001, ns, not significant, anova with Tukey post hoc. (G) Dendritic field area of RGCs, shown with the 0 d value for comparison. *P < 0.05, **P < 0.005, ***P < 0.001, anova with Tukey post hoc. (H) Example of dendritic field area measurement using 8‐bit tracing. Scale bar 100 μm, arrow indicates axon (not included in measurement). (I) Sholl AUCs split according to RGC stratification depth. ON (left): n = 28 cells (0 d), n = 8 cells (control), n = 26 cells (BDNF). OFF (middle): n = 20 cells (0 d), n = 7 cells (control), n = 10 cells (BDNF). ON‐OFF (right): n = 13 cells (0 d), n = 3 cells (control), n = 3 cells (BDNF). *P < 0.05, **P < 0.005, ***P < 0.001, anova with Tukey post hoc. The number of cells analysed (D) are indicated. Error bars ± SEM. d, days.
