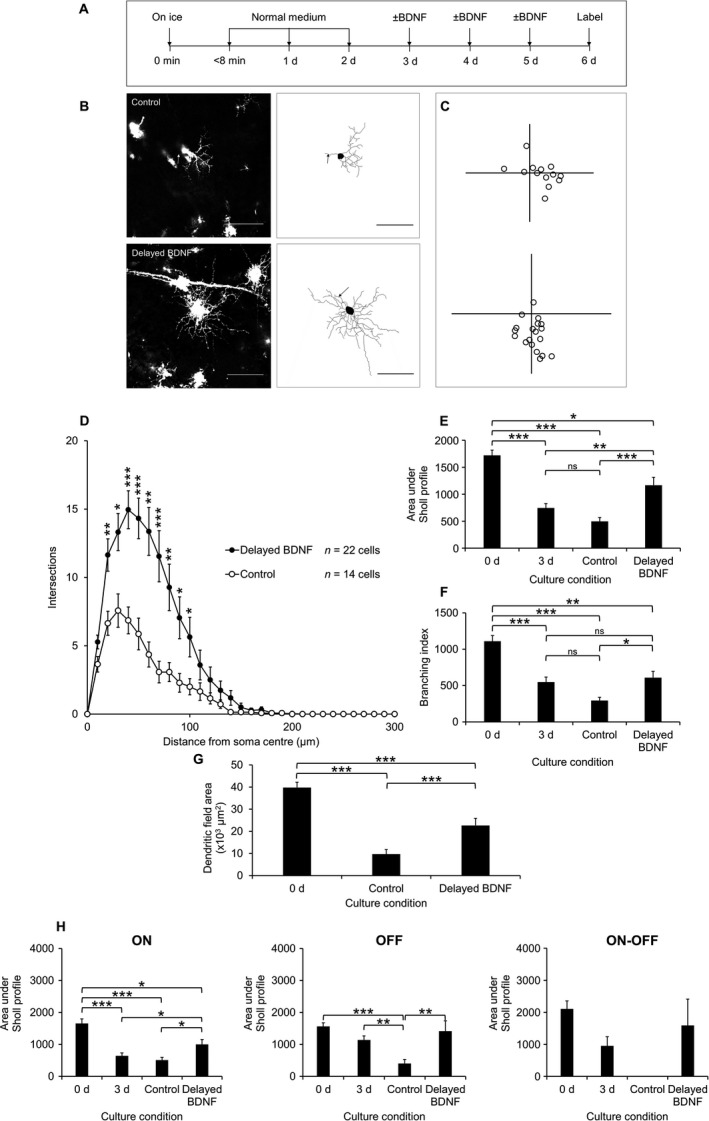
Figure 7.

Diolistically labelled RGCs from explants cultured with 100 ng/mL BDNF or vehicle (PBS, 0.1% BSA) as control over 3 d from day 3 showing that delayed BDNF treatment is capable of retarding dendritic retraction of RGCs. (A) Time course of experiment. (B) Representative 1024 × 1024 pixel images of RGCs from control (top) and delayed BDNF‐treated (bottom) explants with 8‐bit tracing images for each cell (right); scale bars 100 μm; arrow indicates axon. (C) Locations of RGCs from control (top) and delayed BDNF‐treated (bottom) explants plotted relative to the optic nerve head (origin). (D) Sholl profiles for RGCs. *P < 0.05, **P < 0.005, ***P < 0.001, Kruskal–Wallis. (E) Area under Sholl profiles in each group, shown with the values for 0 and 3 d for comparison. *P < 0.05, **P < 0.005, ***P < 0.001, ns, not significant, anova with Tukey post hoc. (F) Branching index of RGCs. *P < 0.05, **P < 0.005, ***P < 0.001, ns, not significant, anova with Tukey post hoc. (G) Dendritic field area of RGCs shown with value for 0 d as comparison. **P < 0.005, anova with Tukey post hoc. (H) Sholl AUCs split according to RGC sub‐type. ON (left): n = 28 cells (0 d), n = 12 cells (control), n = 14 cells (delayed BDNF). OFF (middle): n = 12 cells (0 d), n = 2 cells (control), n = 6 cells (delayed BDNF). ON‐OFF (right): n = 11 cells (0 d), n = 0 cells (control), n = 2 cells (delayed BDNF). *P < 0.05, **P < 0.005, ***P < 0.001, ns, not significant, anova with Tukey post hoc. The number of cells analysed (D) are indicated. Error bars ± SEM. d, days.
