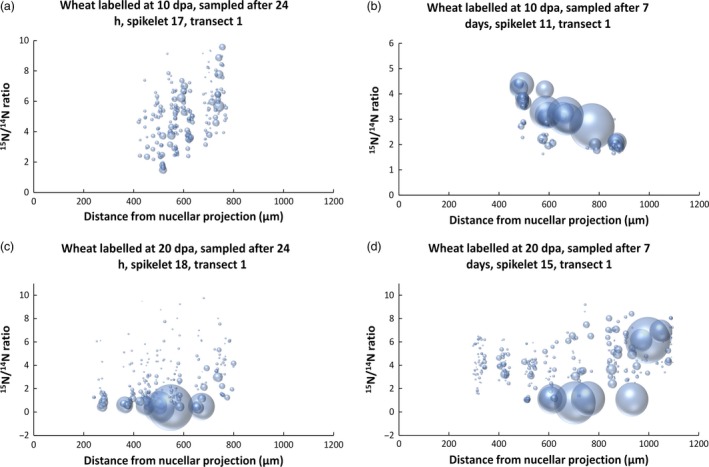
Figure 4.

Graphical representation of the size and 15N enrichment of protein bodies along transect 1 of starchy endosperm tissue after labelling at 10 dpa 24 h (a), 10 dpa 7 days (b) 20 dpa 24 h (c) and 20 dpa 7 days (d). Individual protein bodies are displayed as ‘bubbles’, which correspond in size to their measured areas. The positions of the protein bodies correspond to their locations along the transect (x‐axis) and their degree of enrichment with 15N (y‐axis).
