
Figure 2.
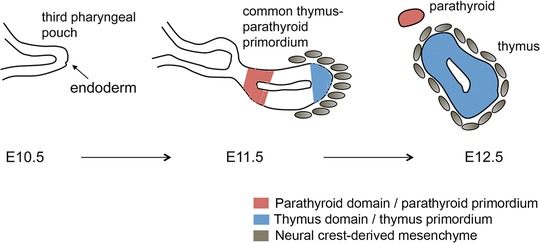
Early events in thymus development. Schematic representation of early thymus development in the mouse. 3PP, third pharyngeal pouch. Gray ovals represent neural crest‐derived mesenchymal cells. Red denotes region of GCM2 expression, marking the parathyroid primordium, blue denotes region of FOXN1 expression, indicating the thymus primordium. E10.5, E11.5, and E12.5 denote day 10.5, 11.5, and 12.5 of embryonic development, respectively.