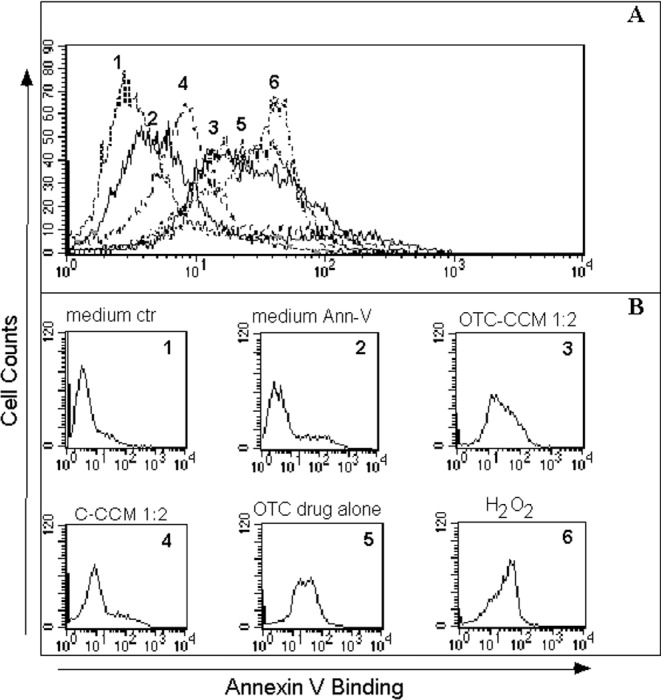
Figure 1.

Apoptosis induction evaluated as fluorescence intensity of fluorescein isothiocyanate–Annexin V-staining in one representative experiment. The upper panel refers to the overlay of all the fluorescence peaks in the different conditions for the K562 cell line cultures. The lower panels represent the fluorescence peaks for each cell condition. The x-axis shows the fluorescence intensity of Annexin V binding on a logarithmic scale. The amplitude of the apoptosis induction is proportional to the right sliding of the peak on the x-axis towards higher values of fluorescence for Annexin-staining (to facilitate the reader's interpretation: Peak 1 is the one that shows the lowest intensity, while Peak 6 represents the peak at the highest intensity in the figure). In all the panels, the peaks correspond to the following different K562 cell culture conditions: 1 = in a growth medium alone without Annexin V staining, as a control of the cell natural fluorescence background; 2 = in a growth medium with Annexin V staining, as a control of the apoptosis that occurs in the K562 cell line maintained in a culture without any other incubation; 3 and 4 = peaks that represent the growth medium with the addition of a conditioned cell culture medium obtained from the ground bone of chickens reared in the presence [3 = oxytetracycline (OTC)–cell culture medium (CCM)] or in the absence [4 = control (C)–CCM] of a treatment with oxytetracycline, at a diluition of 1:2, stained with Annexin V; 4 = in a growth medium with the addition of C–CCM, at a diluition of 1:2, stained with Annexin V; 5 = in a growth medium with the addition of 2 μg/mL OTC, stained with Annexin V; 6 = in a medium with the addition of 100 μM H2O2, stained with Annexin V. The medium volumes for the different cell cultures were the same. See the Material and Methods section for the Annexin V staining.
