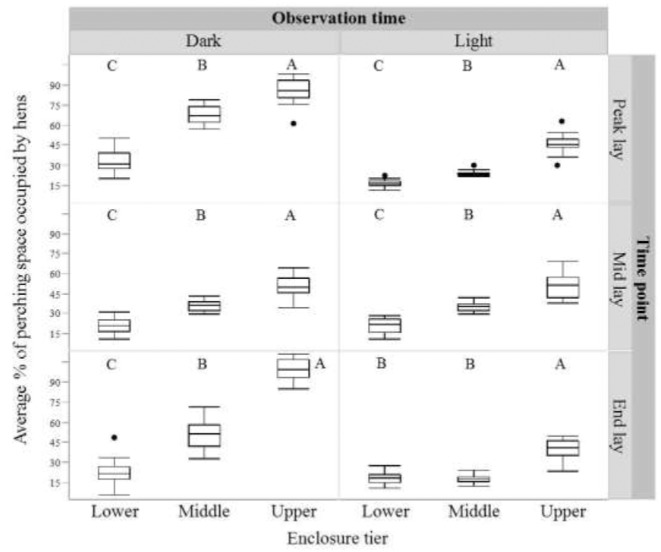
Figure 6.

The average percentage of space occupied by hens on perches only (excluding ledges) within each enclosure tier (lower, middle, upper) before lights on (‘dark’) and after lights on (‘light’) at each sampling age point (peak lay, mid lay and end lay). Dissimilar letters indicate significant differences in the percentage of perching space occupied by hens between enclosure tiers.
