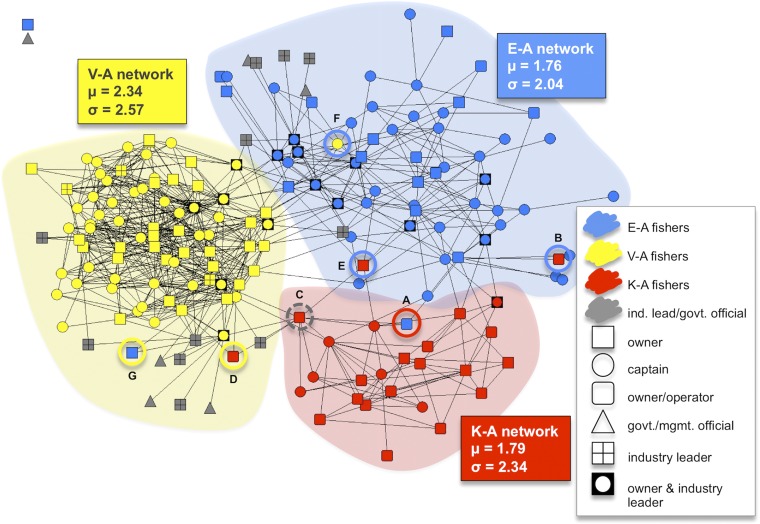
Fig. 2.
Shark bycatch by information-sharing network group. Information-sharing networks in Hawaii’s longline fishery generated in NetDraw (41) using the spring embedding algorithm. Each node corresponds to an individual fisher color coded by ethnicity, or an actor deemed important for information sharing by respondents (i.e., industry leader, government, or management official). Information-sharing groups are delimited by shaded backgrounds, the color of which corresponds to their dominant ethnicity. Two isolates not connected to anyone are located in the top left corner. Circled nodes denote outliers. Those with solid lines represent fishers who have a majority of ties outside their ethnic group, with the color of the circle corresponding to the group they have a majority of ties to. Those with gray dashed lines denote nodes with an equal proportion of ties both within and outside their ethnic group. Excluding these outliers, mean (μ) shark bycatch and SDs (σ) per 1,000 hooks in Hawaii's tuna longline fishery from 2008 to 2012 are reported by community. Although informative, these statistics do not account for the conditions under which fishers are operating, such as when and where they fish, which can substantially influence rates of bycatch.

