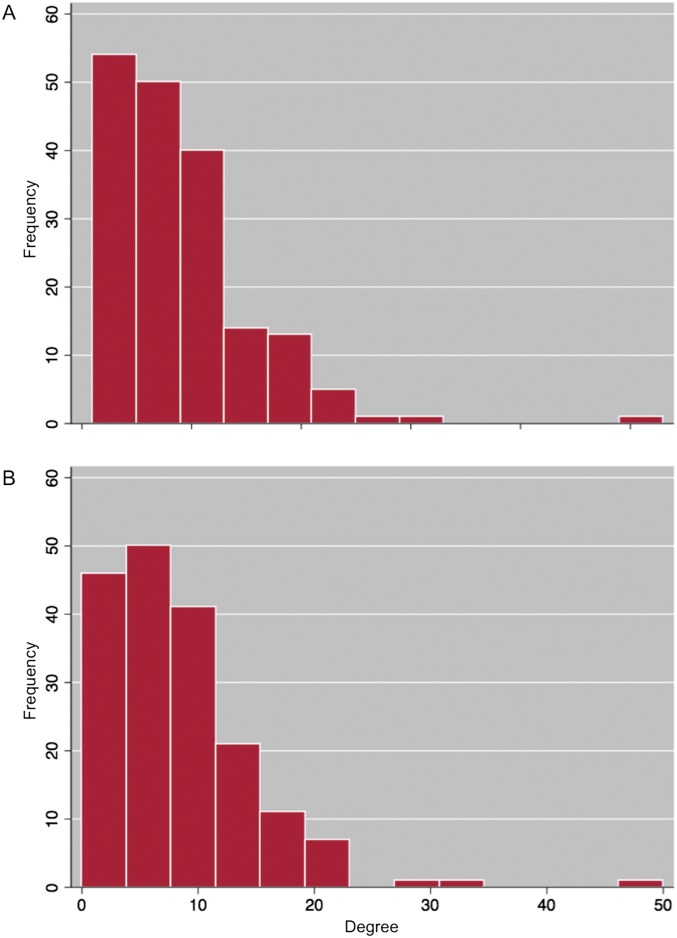
Fig. S3.
Degree distributions of (A) the full network including all fishery-related information-sharing ties identified by respondents, and (B) the network used in this analysis, which is a subset of A that does not include ties identified by respondents as “not valuable” or that are used less than one to three times per month for information sharing.

