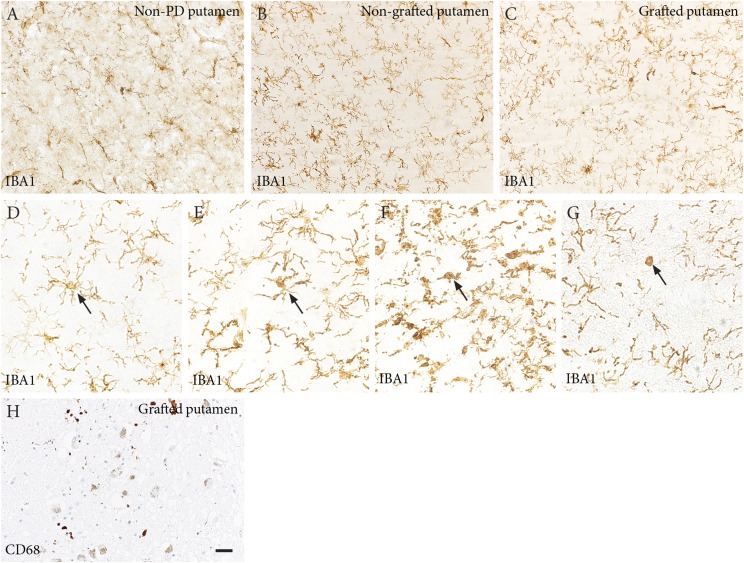
Fig. S2.
(A–C) Microglial reaction to the transplants. IBA1 staining showing microglia cells in the putamen of an age-matched non-PD patient (A) and in the nongrafted (B) and grafted putamen (C) of the PD patient. Quantification of IBA1-positive cells showed no difference in microglia numbers (70 in the control brain, 77 in nongrafted putamen, and 78 in the grafted one on average in each counting field). (D–G) Microglia were classified into four different morphological phenotypes, believed to represent different steps of microglial activation (14): ramified (D), intermediate (E), amoeboid (F), and round (G). No major differences between grafted and nongrafted sides and normal putamen were observed. In control brain: ramified, 89%; intermediate, 7.4%; amoeboid, 2.8%; and round, 0.8%. In nongrafted putamen: ramified, 74%; intermediate, 18%; amoeboid, 7%; and round, 0.4%. In grafted putamen: ramified, 77%; intermediate, 16%; amoeboid, 6%; and round, 0%. In addition, staining with the activated microglia marker CD68 did not reveal any major difference in the number of immunoreactive cells between nongrafted and grafted putamen (62 vs. 82). (H) CD68 staining in the rostral graft. (Scale bars: 20 µm.)

