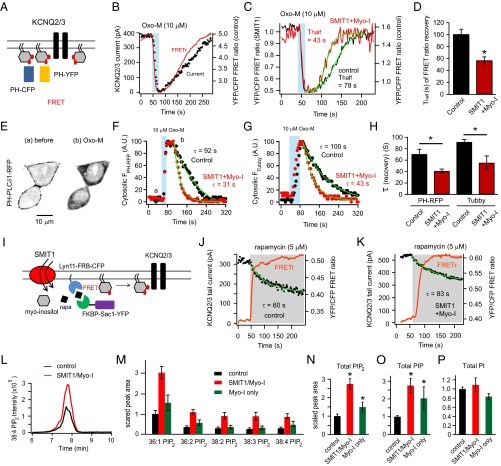
Fig. 4.
SMIT1 plus myo-inositol augment PI(4)P and PI(4,5)P2 pools. (A) Diagram of FRET between PH-CFP and PH-YFP, as they bind to plasma membrane PI(4,5)P2. (B) Simultaneous whole-cell patch clamp recordings and photometric FRET measurements showing parallel changes of KCNQ2/3 current and the PI(4,5)P2 pool after M1 receptor activation by 10 μM Oxo-M. (C) Representative time courses of the FRET ratio after M1 receptor activation with or without SMIT1/myo-inositol. (D) Summary of half time (Thalf) of FRET ratio recovery in experiments like C (n = 5–6). (E) Confocal images showing the translocation of PH-PLCδ-RFP from the plasma membrane to the cytosol after 10 μM Oxo-M application. (F) Representative time courses of the normalized changes in the cytosolic PH-PLCδ-RFP fluorescence intensity after applying Oxo-M with or without SMIT1/myo-inositol; a and b correspond to the left and right images in E. (G) Similar to F but with Tubby-YFP instead. (H) Summary of exponential time constants (τ) of the recoveries of cytosolic fluorescence intensities in experiments as in F (n = 10–12) and G (n = 5–6). Means ± SEM, *P < 0.05. (I) Cartoon illustrating the hydrolysis of PI(4)P using a rapamycin-recruitable lipid 4 phosphatase Sac1. (J and K) Representative experiments showing the reduction of KCNQ2/3 current after applying 5 μM rapamycin with and without SMIT1/myo-inositol. (L) Representative mass spectrometry MRM chromatogram showing that SMIT1/myo-inositol treatment enhanced the peak intensity for C18:0/C20:4 PIP2 extracted from tsA201 cells. (M) Summary histogram showing the effects of SMIT1/myo-inositol treatment on the mass spectrometry quantification of various predominant species of PIP2 (n = 3–6). (N–P) Summary histograms showing the effects of myo-inositol treatment with or without SMIT1 overexpression on the mass spectrometry quantification of total PIP2, PIP, and PI (n = 5–8). Means ± SEM, *P < 0.05.

