Fig. 2.
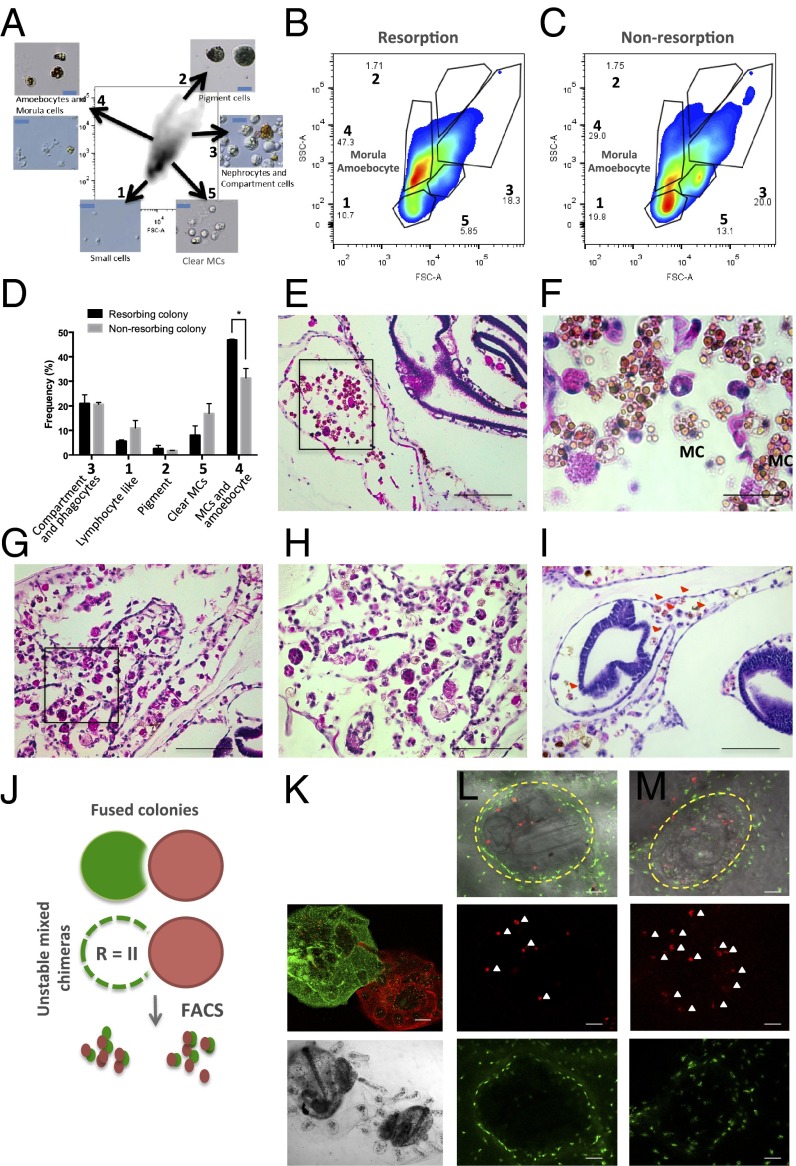
Profiling the cellular composition of allogeneic resorbing colonies. (A) B. schlosseri cell populations were analyzed and sorted using FACS according to their intrinsic size (FSC) and granularity (SSC) properties on log scale. Using this approach, we identified five populations of cells: 1, small lymphocyte-like cells; 2, pigment cells; 3, large phagocytes, nephrocytes, and compartment cells; 4, dark vacuolated morula cells (MCs) and amoebocytes; 5, clear MCs. In captions are representative images of sorted populations. (Blue scale bars: 20 µm.) (B and C) Representative FACS plots from a nonresorbing and resorbing partner. An increase in frequency of cells with intermediate/high side scatter (SSC), low forward scatter (FSC) was observed in resorbing partners (population 4). (D) Cellular composition of allogeneic resorbing and nonresorbing colonies; as above, significant increase of MCs and amoebocytes was observed in resorption (ANOVA, P < 0.05). (E and F) H&E-stained tissues show pronounced infiltration of MCs and prominent phagocytic infiltration, indicating severe allogeneic resorption. (Scale bars: Left, 200 μM; Right, 100 μM.) (G and H) H&E-stained tissues at the time of takeover show heavy infiltration of macrophages, but limited numbers of MCs. (I) Developing structures are infiltrated by allogeneic partner cells (red arrows). (J) Schematic of live cell fluorescent imaging of labeled colonies to identify source of infiltrating cells. (K–M) Partner cells traffic into developing buds (outlined in yellow). Allogeneic red cells (white arrows) infiltrate green-labeled colonies.

