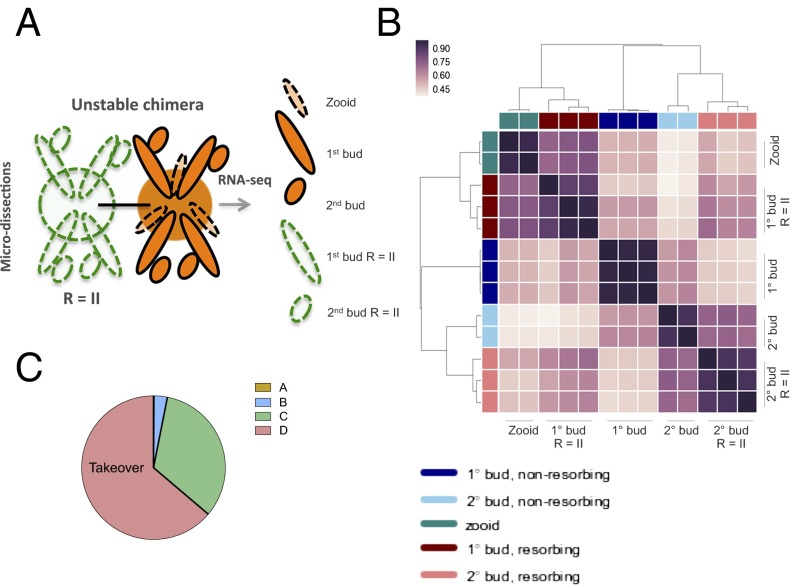
Fig. 4.
RNA-seq analysis of allogeneic resorbing colonies. (A) Schematic of RNA-seq experiments. Allogeneic, but compatible, defined lines were fused in colony allorecognition assays and then harvested for RNA-sequencing. Biologic replicates were obtained from stage R = II (resorption score = II) 1° (primary) and 2° (secondary) buds, corresponding to developmental stage D. (B) A hierarchical clustering matrix was generated using Pearson correlation coefficients from log2 counts per million across all genes. Widely divergent transcriptomes were observed across resorption status and developmental stage. The color scale indicates the degree of correlation (white, low correlation; purple, high correlation). (C) Pie chart showing blastogenic stage at time of chimeric resorption.

