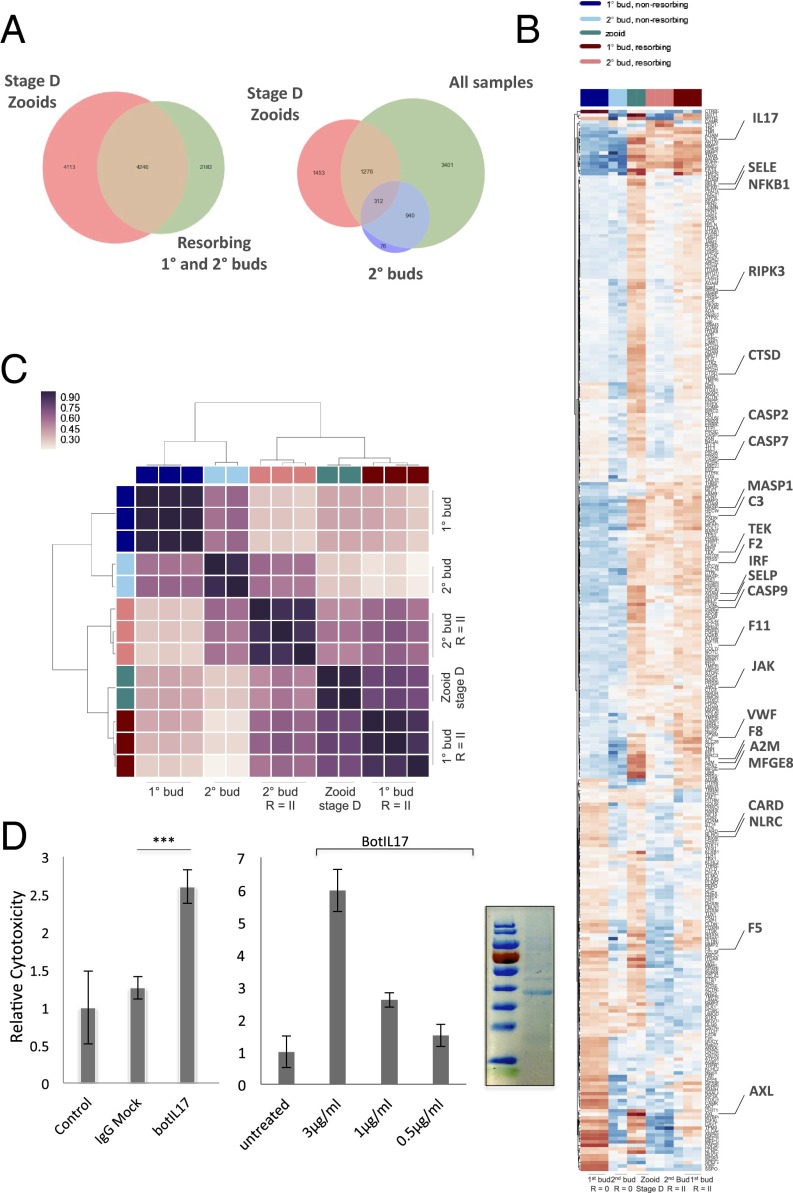
Fig. 5.
Identification of licensing pathways from RNA-seq datasets. (A) Adult zooids were isolated during the takeover phase for RNA-sequencing and compared with R = II allogeneic resorbing tissues to identify shared pathways. Venn diagram plots for differentially expressed genes between nonresorbing 1° and 2° buds, zooids, and resorbing 1° and 2° buds. 1°, primary bud; 2°, secondary bud; R = II (resorption score = II). (B) Genes that were found to be differentially expressed in allogeneic resorbing tissues were intersected with significant GO terms (immune system process and cell adhesion) and displayed in a heat map. Each gene is represented by a single row in the heat map; the color scale ranges from −5 to 5 cpm (blue, low; red, high). Allogeneic and takeover tissues share expression profiles for a number of genes implicated in immunity (highlighted). (C) Hierarchical clustering matrix for differentially expressed genes among allogeneic resorbing tissue samples indicates clustering with stage D takeover pathways. The color scale indicates the degree of correlation (white, low correlation; purple, high correlation). (D) Bot IL17 significantly enhances cytolytic activity in allogeneic in vitro assays compared with untreated and human Fc control (ANOVA). (Left) Bot IL17, 1 µg/mL. (Right) Bot IL17 demonstrates a dose-dependent enhancement of lytic activity in allogeneic cytotoxicity assays. Assays were performed in 96-well plates overnight using differentially labeled cells from allogeneic colonies in 1:10 effector:target ratios, and analyzed by FACS. Error bars = SD. SDS/page analysis of purified recombinant IL17 (Far Right).

