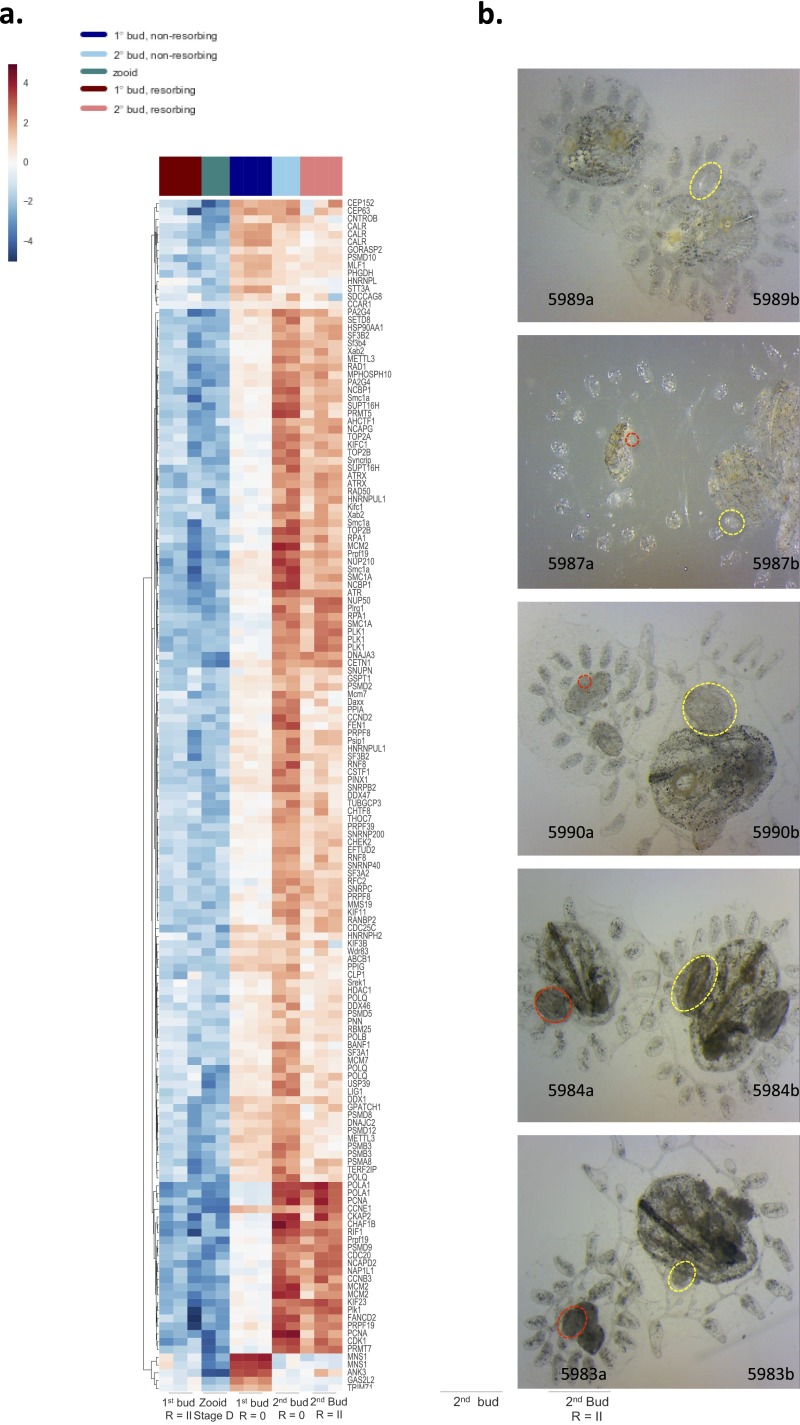
Fig. S3.
Effects of allogeneic resorption on developmental signaling. (A) Heat map and hierarchical clustering analysis among GO term developmental gene sets (GO terms: chromosome organization, cell cycle, RNA splicing, and DNA replication). Each gene is represented by a single row in the heat map; the color scale ranges from −5 to 5 cpm (blue, low; red, high). Aberrant developmental gene expression profiles are observed across both allogeneic resorbing 1° and 2° buds. (B) Representative images of fused pairs undergoing allogeneic resorption (red circles indicate abnormal developing primary and secondary buds; yellow circles indicate normal buds).

