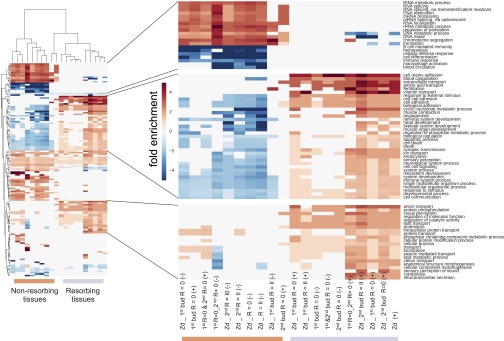
Fig. S5.
GO-category hierarchical clustering of differentially expressed genes across samples. GO category analysis of B. schlosseri microdissected tissue samples. Hierarchical clustering (using city block distance) of GO scores for categories that are statistically significant are displayed in a heat map. Each column represents the result for one comparison, with test group and direction of expression given as a column name. The values of entries are the multiplicative enrichment (reds) and depletion (blues) of genes falling within the given GO category. This analysis reveals two large clusters differentiated by GO term signatures: The left cluster (orange bar) has genes that are higher in buds than zooids and higher in the nonresorbing tissues; the right cluster (purple bar) has genes that are higher in zooids and resorbing tissues, mirroring development stage and resorption status. 1°, primary bud; 2°, secondary bud; Zd, Zooid stage D; R = 0, resorption score = 0; R = II, resorption score = II; (−), down-regulated; (+), up-regulated.

