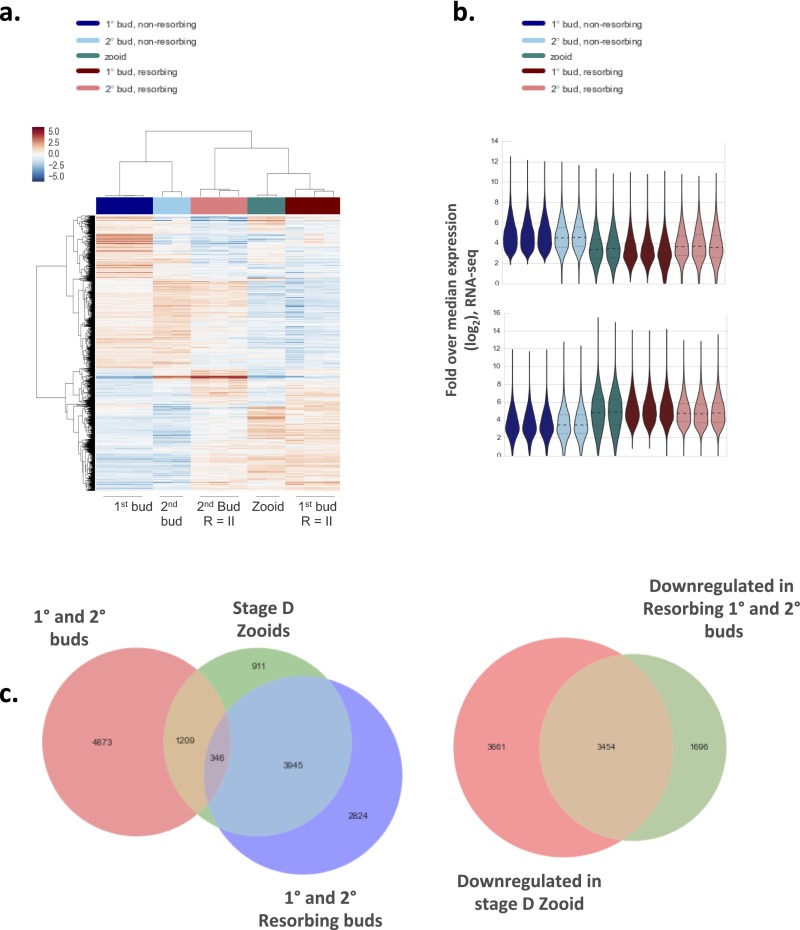
Fig. S6.
Profiling allogeneic resorption with RNA-seq. (A) Heat map and cluster analysis demonstrate clear differences among transcriptomes observed across developmental stage and resorption status. (B) Frequency distribution of expression values from RNA-seq bulk samples shown as a violin plot. Expression (vertical axis) is the log2-transformed fold change over median gene expression level across samples. The width of the violin indicates frequency at that expression level. The Top violin plot shows differentially expressed genes in nonresorbing tissues whereas the Bottom violin plot shows differentially expressed genes in resorbing tissues. (C) Venn diagrams among differentially expressed genes between samples. Takeover and allogeneic resorbing tissues share significant overlap in gene expression profiles.

