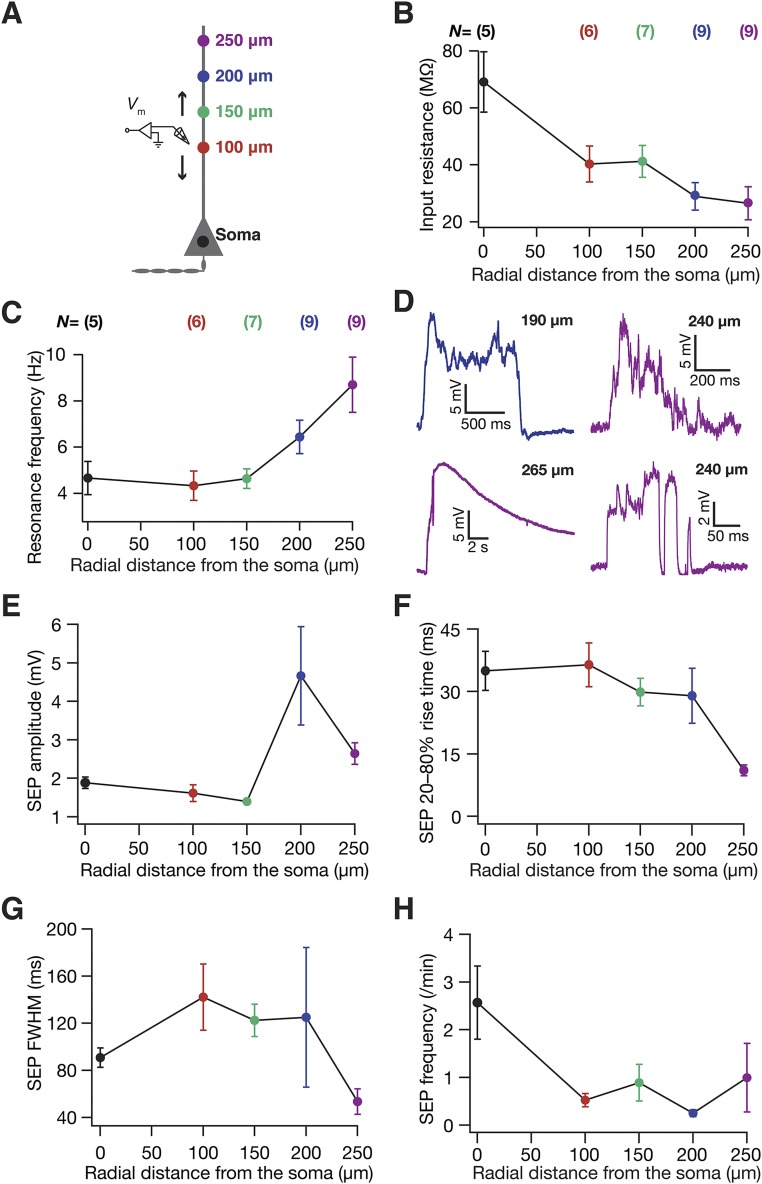
Fig. S1.
sSEPs and neuronal intrinsic properties exhibited location dependence along the somato-apical trunk. (A) Schematic of experimental setup with color codes representing locations. (B and C) Input resistance (B) and resonance frequency (C) recorded at different locations along the somato-apical trunk in CA1 pyramidal neurons, consistent with previous reports of these measurements (15, 35). (D) Example traces of clustered sSEPs recorded at distal dendritic locations. The incomplete Bottom Left trace with a rise time of 540 ms and a width of ∼9.5 s was not included in the analyses. (E–H) sSEP amplitude (E), 20–80% rise time (F), FWHM (G), and frequency (H), all represented as mean ± SEM, plotted as functions of radial distance from the soma. These plots correspond to data presented in Fig. 1 C, E, G, and I, respectively. N = number of neurons recorded; n = number of SEPs recorded.

