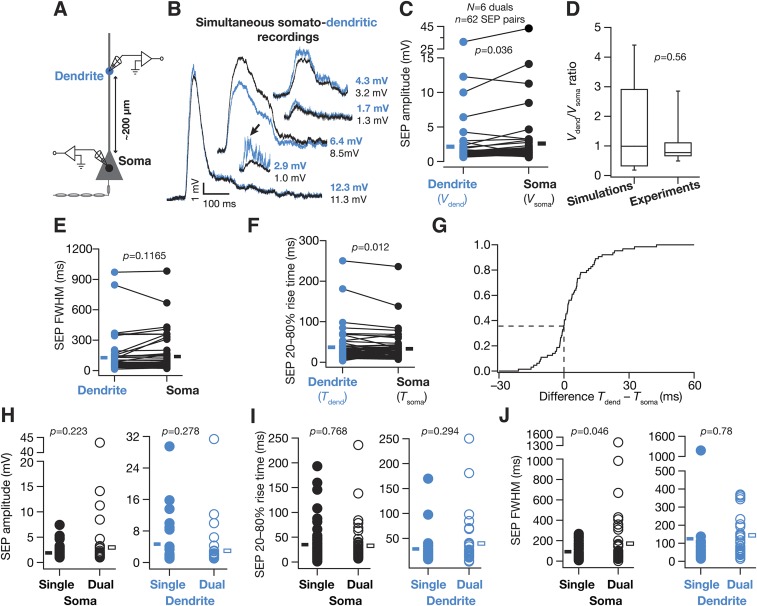
Fig. S2.
The distribution of SEP amplitudes recorded simultaneously from somatic and dendritic locations was consistent with simulations where SEPs originated across a large span of the somatodendritic arbor. (A) Schematic of experimental design used for simultaneous recording of sSEPs at the soma and apical dendritic trunk ∼200 µm (194.8 ± 7.7 µm, mean ± SEM; N = 6 simultaneous recordings; n = 62 sSEP pairs) away from the soma, also providing color codes for the other panels. (B) Representative traces of temporally aligned spontaneous SEPs, recorded simultaneously at the soma and the dendrite. It should be noted that the dendritic SEP amplitudes were similar, greater than or less than the somatic SEPs, a manifestation of multiple locations of origin of SEPs along the somatodendritic arbor. Arrow shows a dendritic event consisting of multiple overriding SEPs, which resembles a single event at the soma when subjected to dendritic filtering. (C) Population data of dendritic (Vdend) and somatic (Vsoma) SEP amplitudes obtained from the simultaneous somatic and dendritic recordings. Solid rectangles correspond to population mean values. (D) Distribution (median and quartiles) of the ratio of simultaneously recorded Vdend to Vsoma from the population data shown in C (Experiments). This distribution of voltage ratios was compared with a corresponding distribution from simulations (Simulations; outcomes from Fig. 8 and Fig. S10), showing the ratio between the SEP amplitude at an apical trunk location at 200 µm (to match with experiments) and the corresponding SEP amplitude at the soma. This ratio was computed from simulations (10 epochs) where the receptor (point of origin of the SEP) was randomly located at one of the apical dendritic compartments within 250 µm of radial distance from the soma. To match with experimental analyses, SEPs whose dendritic or somatic amplitudes were greater than 1 mV were retained, leaving the total SEPs at 680. Despite the dendritic origins of these simulated events (mostly in thin obliques, which occupy most of the surface area in CA1 pyramidal neurons), and despite the higher density of dendritic NMDARs in these simulations (Fig. 8), a majority of events (63.2%) recorded in simulations had their dendritic SEP amplitude lower than that of their somatic counterparts, which matched with experimental observations where a majority of events (72.6%) had their Vdend/Vsoma less than 1. Importantly, the distribution of the ratio of Vdend/Vsoma from the simulated events was not significantly different from the Vdend/Vsoma ratio distribution obtained from experiments (Wilcoxon's rank sum test, P = 0.56), suggesting that the SEPs originated from a broad span of the dendritic tree. Finally, although our simulations did not include SEPs with basal dendritic origin, in experiments, SEPs could have originated from basal dendrites with events that have Vdend/Vsoma less than 1 (as recordings were performed from the apical trunk). (E) Population data of FWHM of dendritic and somatic SEPs obtained from the simultaneous somatic and dendritic recordings. Solid rectangles correspond to population mean values. (F) Population data of 20–80% rise time of dendritic (Tdend) and somatic (Tsoma) SEPs obtained from the simultaneous somatic and dendritic recordings. Solid rectangles correspond to population mean values. (G) Normalized cumulative histogram of the difference in the 20–80% rise times of dendritic and somatic spontaneous SEPs recorded simultaneously at both locations. Owing to random somatodendritic origins of SEPs, the difference (Tdend – Tdend) followed a distribution where 37.5% of dendritically recorded SEPs were faster than the somatically recorded SEPs, with the rest assuming an opposite sign. (H and I) Somatic and dendritic SEP amplitudes (H) and rise times (I) were not significantly different from corresponding spontaneous values presented in Fig. 1. (J) Somatic and dendritic FWHM values were comparable to corresponding spontaneous values presented in Fig. 1. For H–J, data from soma and 200-µm spontaneous SEPs from Fig. 1 were respectively compared with somatic and dendritic events (≥1 mV) under simultaneous somatodendritic recordings. Single, spontaneous SEPs recorded from individual somatic or dendritic recordings, presented in Fig. 1; Dual, spontaneous SEPs recorded under the simultaneous somatodendritic recording configuration. Rectangles represent population means. The frequency of sSEPs from Fig. 1 was also not significantly different from that of their counterparts recorded under the simultaneous somatic and dendritic recording configuration (Wilcoxon's rank sum test, P = 0.42).

