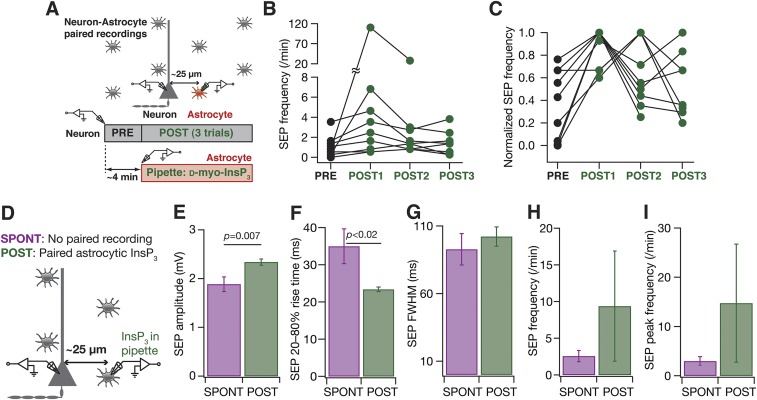
Fig. S5.
Infusion of InsP3 into astrocytes resulted in an increase in SEP amplitude and frequency. (A) Schematic of the experimental design for paired astrocyte–neuron recordings with 10 µM InsP3 in the astrocytic recording pipette. (B) SEP frequency recorded before (PRE) and in three consecutive epochs of ∼4 min (POST1, POST2, and POST3) after infusion of 10 µM InsP3 into a nearby astrocyte. (C) Normalized SEP frequencies for the data presented in B. It should be noted that the POST SEP frequency peaked at different recording epochs in different neurons, and the peak SEP frequency was always higher than the PRE SEP frequency. For B and C, sticks connect frequencies of the same neuron. (D) Schematic representation of experimental design. Whereas spontaneous SEP recordings (SPONT) were obtained without any paired astrocytic recordings, SEPs with astrocytic InsP3 were recorded after (POST) patching a nearby astrocyte with 10 µM d-myo-InsP3 in the recording pipette. SPONT data were derived from spontaneous somatic recordings presented in Fig. 1, and POST data were derived from POST recordings shown in Fig. 4. (E–I) Amplitude (E), 20–80% rise time (F), FWHM duration (G), frequency (H), and peak frequency (I) of spontaneous and astrocytic InsP3-induced SEP recorded at the soma. Data are presented as mean ± SEM, and P values correspond to Student’s t test.

