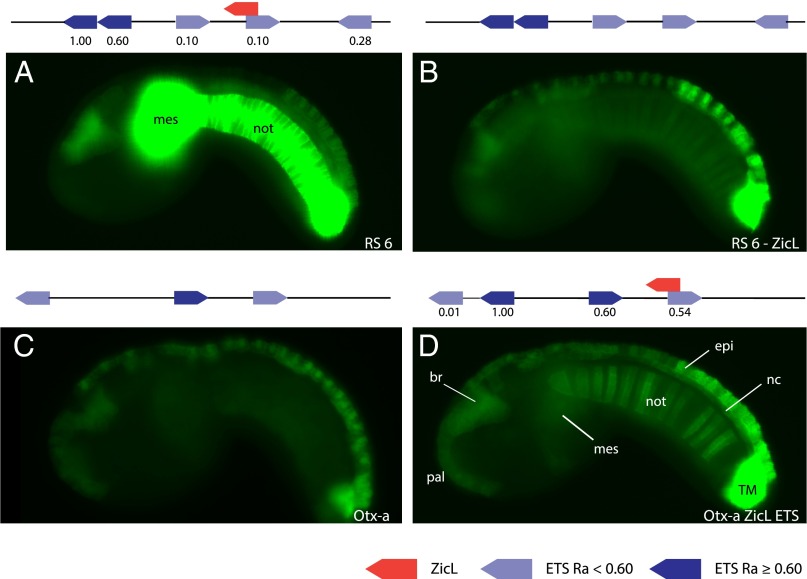
Fig. 1.
ETS and ZicL mediate notochord expression. (A) Embryo electroporated with RS 6; GFP expression can be seen strongly (≥10% saturated pixels at 500 ms exposure time) in the notochord (not) and mesenchyme (mes), and moderately in the anterior brain and dorsal epidermis. Expression in this embryo is saturated, as all images in this figure are taken at the same exposure time. Please see SI Appendix, Fig. S1, for images of this embryo at other exposure times. (B) Embryo electroporated with RS 6 −ZicL, where the ZicL site has been mutated. GFP expression is only weakly (<10% saturated pixels at 800 ms) in the notochord. (C) Embryo electroporated with Otx-a; GFP expression can be seen in the anterior brain, palps, dorsal nerve cord, dorsal epidermis, and two tail muscle cells. No expression is seen in the notochord. (D) Embryo electroporated with Otx-a ZicL ETS, where the sequence was modified to add a ZicL and ETS site similar to RS 6. Moderate GFP expression is now seen in the notochord as well as locations of endogenous Otx-a expression anterior brain (br), palps (pal), dorsal nerve cord (nc), dorsal epidermis (epi), and two tail muscle cells (TM). A schematic of the sequence electroporated is shown above each image. Dark-blue arrows refer to ETS binding sites with a relative binding affinity (Ra) ≥0.60, which is classified as a high binding affinity; light-blue arrows refer to ETS binding sites with a binding affinity <0.60; and red arrows refer to a ZicL binding site. All images were taken at the same exposure time. For counting of expression, see SI Appendix, Fig. S1.

