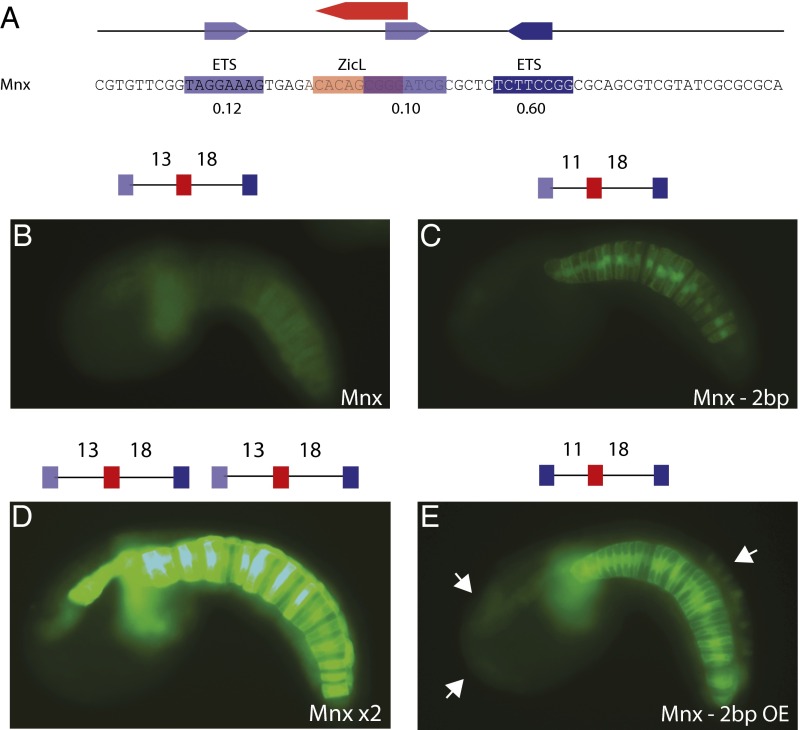
Fig. 3.
Identification of the Mnx enhancer, using compensatory regulatory logic. (A) The 69-bp sequence of an Mnx enhancer located 690 bp upstream of the transcription start site for Mnx. Relative binding affinities are shown below sites. (B) Embryo electroporated with Mnx enhancer; GFP expression can be seen weakly in the notochord. (C) Embryo electroporated with Mnx −2 bp enhancer; GFP expression is stronger in the notochord compared with Mnx. (D) Embryo electroporated with Mnx ×2 enhancer; GFP expression can be strongly in the notochord and the floor plate and moderately in the mesenchyme. (E) Embryo electroporated with Mnx −2 bp with optimized ETS (OE) enhancer; GFP is strongly expressed in the notochord compared with Mnx −2 bp. White arrows point to ectopic expression in the palps, anterior brain, and dorsal epidermis. A schematic of the sequence electroporated is shown above each image. Dark-blue boxes refer to ETS binding sites with a binding affinity above 0.60, light-blue boxes refer to ETS binding sites with a binding affinity lower than 0.60, and red boxes refer to a ZicL binding site. All images were taken at the same exposure time to allow for direct comparison. For counting, see SI Appendix, Fig. S6.

