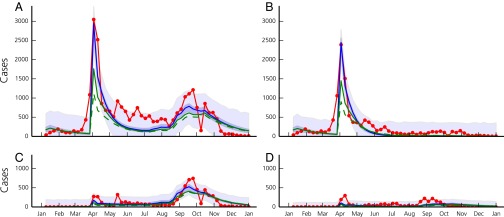
Fig. 2.
Reported (red line) and modeled number of new cases per week for the entire country of Senegal (A), and for the regions of Diourbel (B), Dakar (C), and Thiès (D). Blue lines correspond to runs of the model (Eqs. 1–4) with the best posterior parameter set. Shaded bands correspond the 2.5–97.5 percentiles of the uncertainty related to parameter estimation (dark blue) and of the total uncertainty assuming Gaussian, homoscedastic error (light blue). Modeled cases under the assumption of a 10% (solid green line) and 20% (dashed green line) reduction in transmission in Touba during the GMdT are also shown.

