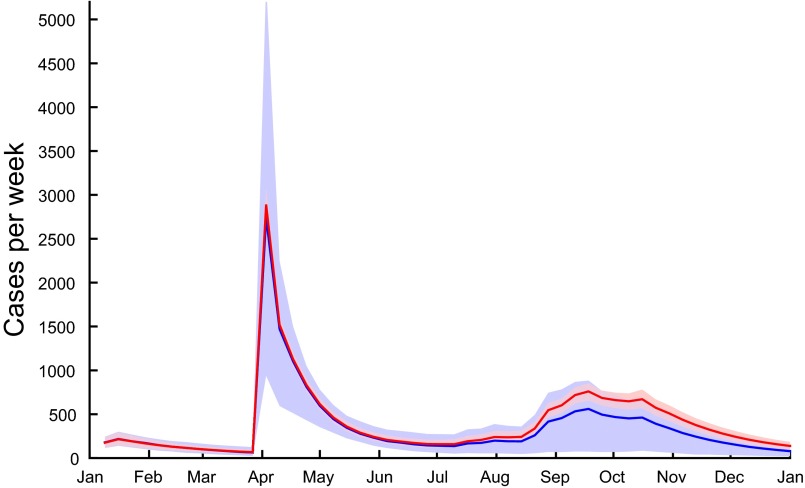
Fig. S5.
Modeled number of new cases per week in the entire country of Senegal according to the continuous (red) and the discrete stochastic (blue) implementations of model A. Red shaded areas correspond to the 2.5–97.5 percentiles of the uncertainty related to the posterior parameter of the continuous model. Blue shaded areas correspond to 2.5–97.5 percentiles over 1,000 model runs using parameter sets drawn from the posterior distribution of the continuous model. Solid lines show the median.

