Fig. 3.
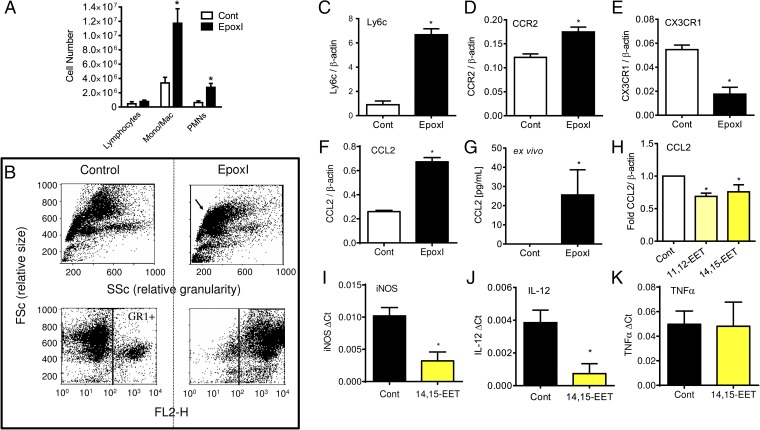
Epoxygenase inhibition during resolution causes Ly6chi monocyte recruitment and Ccl2 generation. (A) Change in lymphocytes, monocytes/macrophages, and PMNs in the peritoneal cavity of mice 48 h postzymosan treatment. At 24 and 36 h, mice were given either sterile PBS or epoxI (30 mg/kg, i.p.). Total cell numbers were counted on a hemocytometer and the proportion of each cell type was determined by FACS. Data represent the mean ± SEM from n = 6 mice per group; *P < 0.05 by unpaired t test between vehicle (Cont; PBS) and epoxI-treated mice. (B) Example of FACS analysis of total cell (Upper) and GR+ populations (Lower) of cells elicited by zymosan alone (control; Left) or in the presence of epoxI (Right) in terms of size (FSc) and granularity (SSc). (C–F) Relative expression of Ly6c (C), Ccr2 (D), CX3CR1 (E), and CCL2 (F) mRNA compared with β-actin in elicited cells from zymosan + control or epoxI-treated mice taken at 48 h. (G) CCL2 generation in cells from zymosan + control or epoxI-treated mice. Cells were elicited at 36 h and left for a further 8 h ex vivo and CCL2 was measured by ELISA. (H–K) CCL2 (H), iNOS (I), IL-12 (J), and TNFα (K) mRNA expression in zymosan-elicited cells at 36 h treated with 14,15-EET or 11,12-EET. Cells were elicited at 36 h and treated for a further 7 h with EETs. Data represent the mean ± SEM from n = 3–4 mice per group; *P < 0.05 by unpaired t test between vehicle (Cont; PBS) and epoxI-treated mice.

