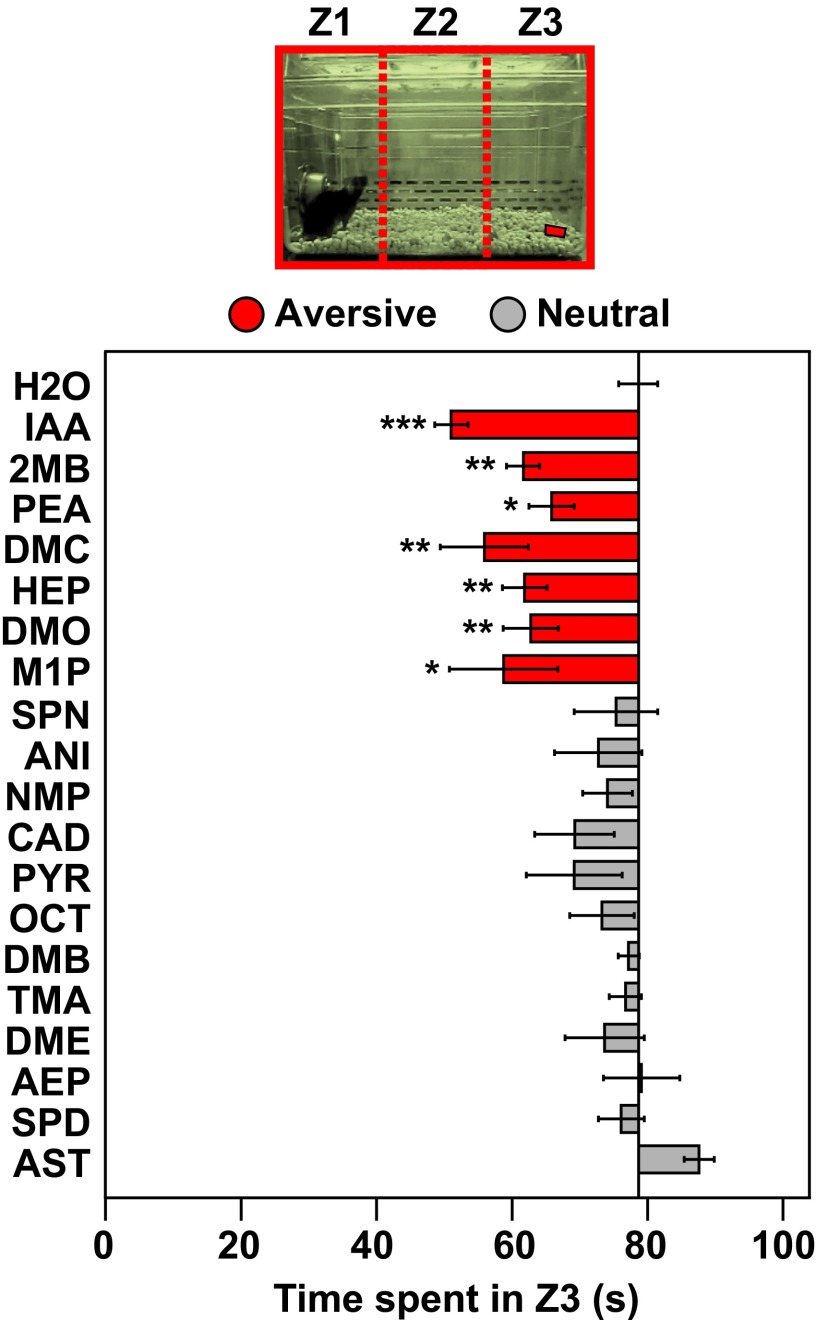
Fig. S3.
Innate avoidance test using TAAR ligands. Video recordings of mice exposed to TAAR ligands in the olfactory preference test (Fig. 1B) were additionally analyzed in a three-compartment innate avoidance test. Using Ethovision XT11 software, the test cage was divided into three zones of equal size [Zone 1 (Z1), Zone 2 (Z2), and Zone 3 (Z3)], and the time an animal spent in Z3 during a 3-min period was measured. Filter paper containing odorant or water was located in Z3. If an animal spent significantly less time in Z3 when exposed to an odorant versus water, it was considered an avoidance response. Bars indicate mean investigation time and error bars show SEM (n = 5–9 animals/odorant or water). Asterisks indicate responses significantly different from water (unpaired t test, two-tailed): *P < 0.05; **P < 0.01; ***P < 0.001. Bars are colored to indicate avoidance (red) or a neutral response (gray). Attractive responses were not seen with this assay. Seven TAAR agonists elicited aversion, including the three that caused aversion in the innate olfactory preference test (Fig. 1B).

