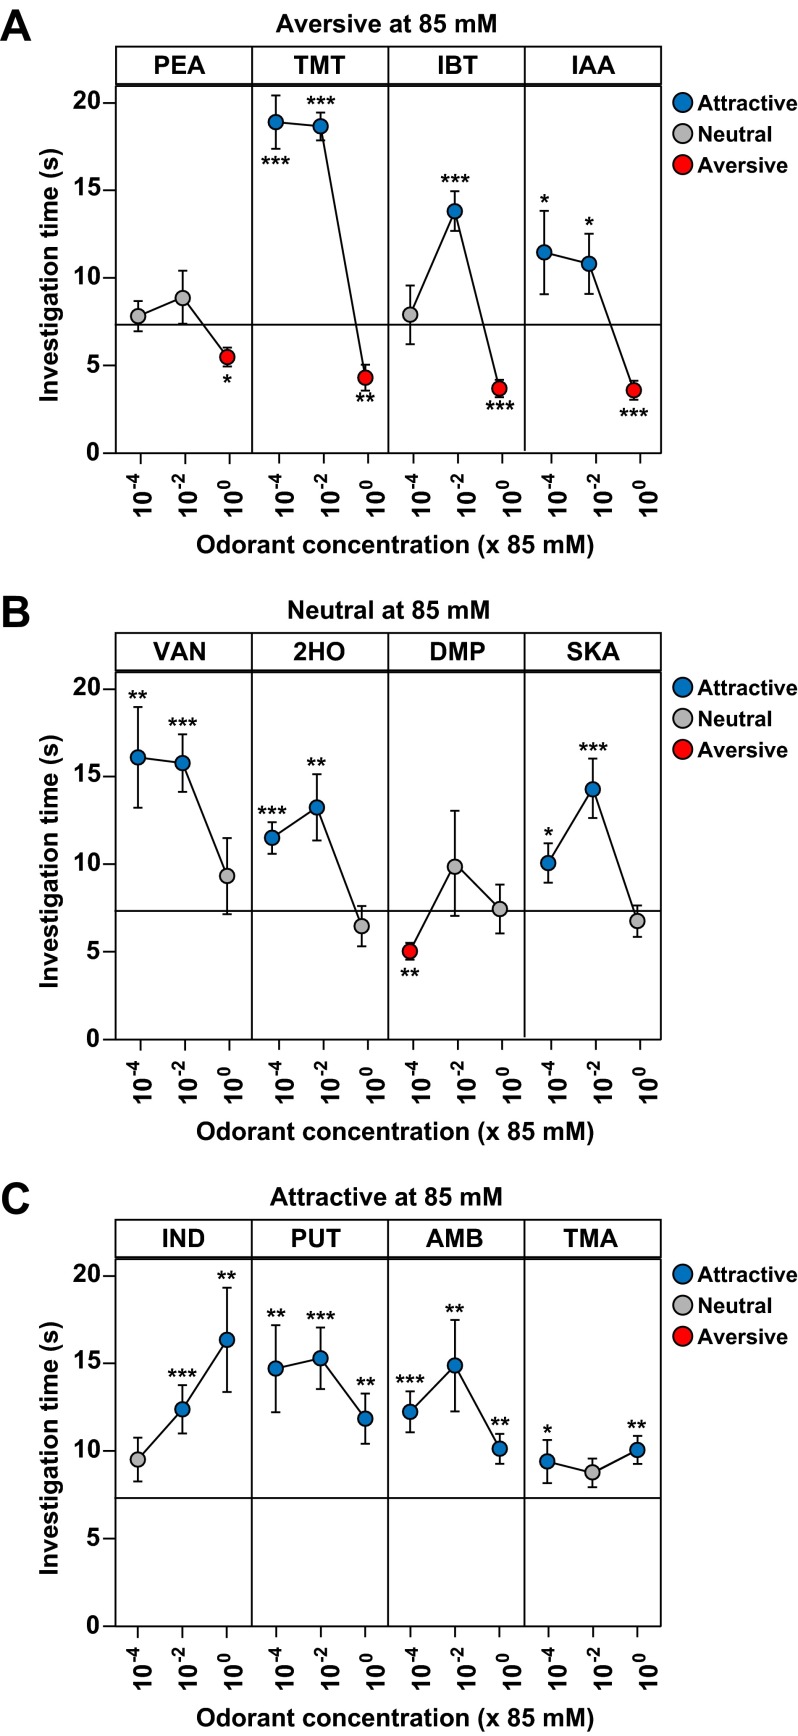
Fig. S6.
Concentration effects on behavioral responses to odorants. The olfactory preference test (see legend to Fig. 1) was used to assess the effects of concentration on responses to specific odorants that were aversive (A), neutral (B), or attractive (C) at 85 mM, as seen in Fig. 1. Shown here are results obtained using 85 mM (10−0) and 102- and 104-fold dilutions. Balls and error bars show mean investigation time ± SEM (n = 5–9 animals/odorant or water) and are colored, as indicated, according to whether they reflected attraction, aversion, or a neutral response. Asterisks indicate responses significantly different from water (unpaired t test, two-tailed): *P < 0.05; **P < 0.01; ***P < 0.001.

