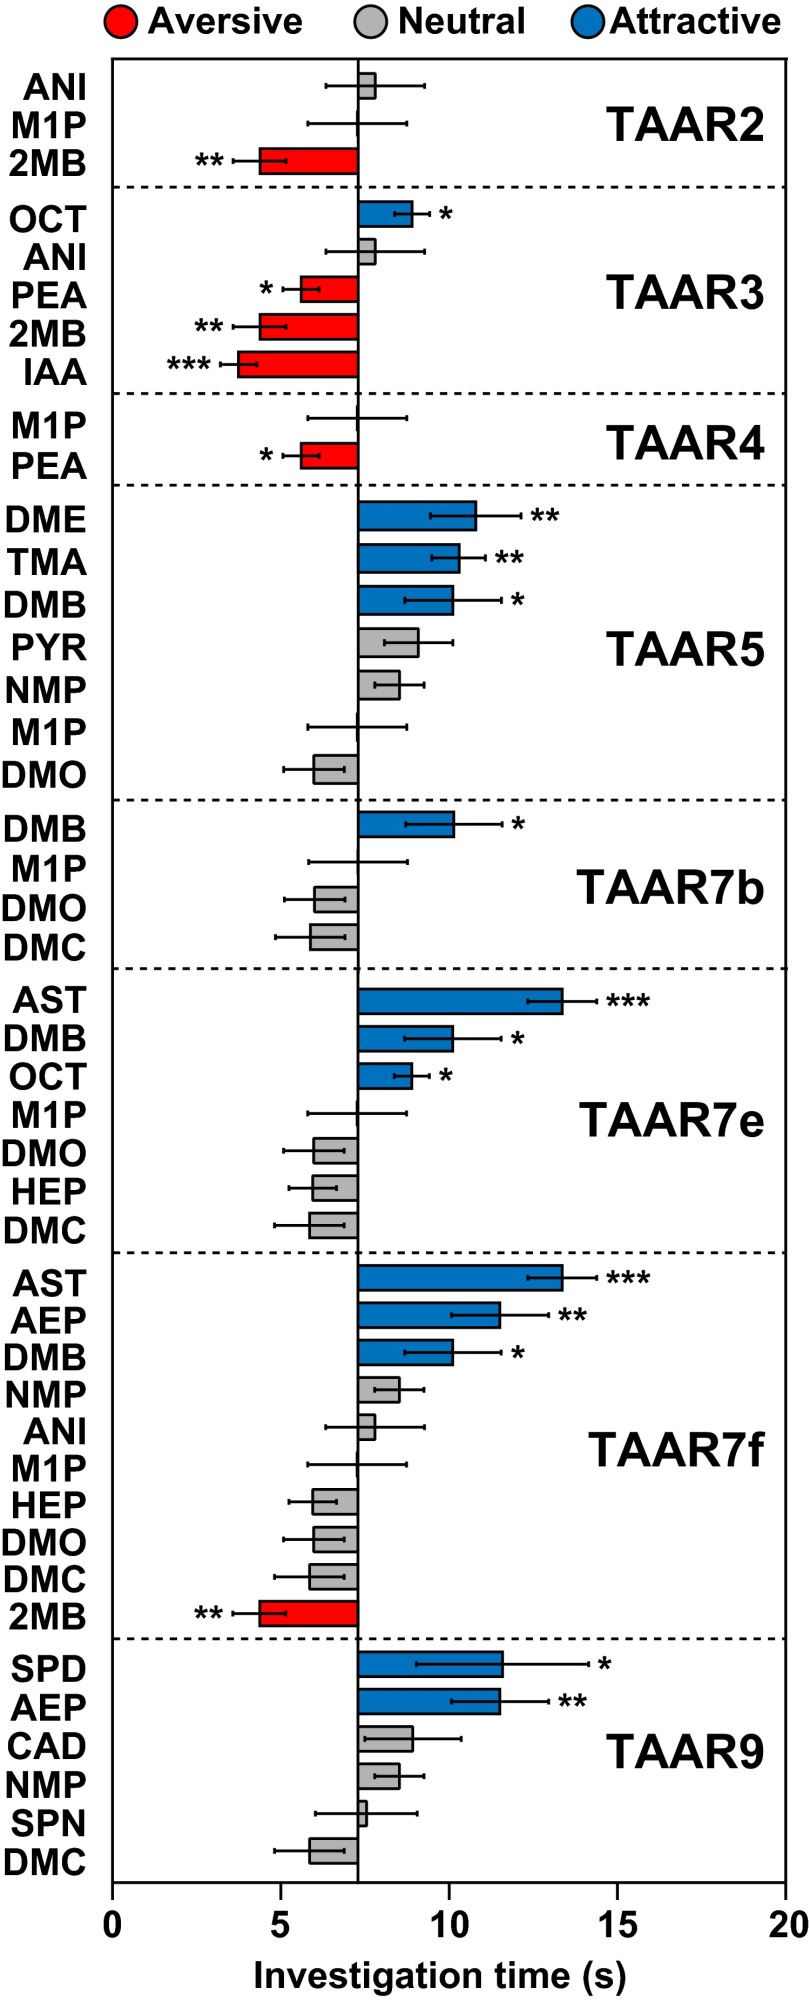
Fig. S7.
Behavioral effects of different ligands for individual TAARs. Odorants detected by individual TAARs are shown together with the behavioral responses to those ligands seen in Fig. 1. Asterisks indicate responses significantly different from water (unpaired t test, two-tailed): *P < 0.05; **P < 0.01; ***P < 0.001. Eight TAARs recognized more than one odorant. In every case, ligands for the same TAAR elicited different behaviors. Aversive, neutral, and attractive behavioral responses are shown in different colors, as indicated.

